Springing Forward

Inside the Crater went silent a year ago, but life kept on moving ahead, dragging and pushing me along too. With the time change this morning to move ahead an hour for Daylight Savings Time, I thought this would be a good time to reactivate Inside the Crater.

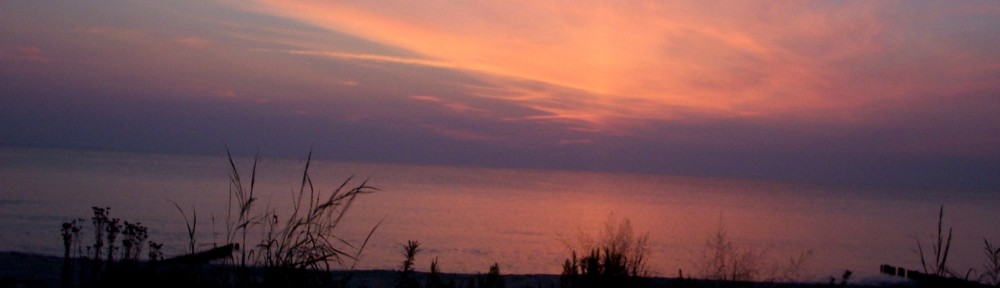
VDOT finished a part of the Canoe Yard Trail outfall and roadside ditch last year, so the rainfall runs crystal clear to the marsh now.

1545092_571497736259832_880957770_n

This is our one shining success story for the Ditches of Mathews County Project, even if it’s incomplete, but we’ll accept it with thanks. It proves what we’ve said all along: if the roadside and outfall ditches are cleaned, have the proper grade and the pipes are open–Mathews has no trouble draining its stormwater, even in Onemo with its low elevation.

The EPA approved our TMDL Implementation Plan to improve the water quality in the Piankatank/Milford Haven/Gwynn’s Island watershed, but the Ditch Maintenance Task Force recommendation still needs to be organized. It’s on my list, after I finish my book, Drowning a County.

Drowning a County traces the history of highway drainage in Mathews County and the institutional myths the Virginia Department of Transportation’s used to explain away their failure to maintain their systems for decades. The book debunks those myths with published mainstream scientific information, translated into normal English.

To do this, I tracked down Army Corps of Engineers hurricane surveys from the 1950’s and 60’s and a 1980 drainage study of the Garden Creek watershed. I learned a lot about Mathews County in reading through 34 years of Board of Supervisors minutes about ditches and VDOT and the revenue-sharing for ditches saga from 1993 to 2008.

Wetlands ecology wasn’t on my reading list, but turned out to be an essential element, aided by the Mathews Memorial Library’s acquisition of an excellent textbook.

GC Morrow taught me how to find overgrown outfall ditches and probe for pipes under the road that could no longer be seen and how to use topo maps to track the streams channelized as outfalls.

Blue dashed lines were drainage structures and streams in 1965–some of which are now totally obstructed. Image courtesy of USGS from Mathews topo map

Can’t count how many wonderful Mathews residents stopped to see if I needed help while photographing ditches from the roadside. And that is probably the biggest factor in why I kept going on this project: the people of Mathews. They are good people with a long history here. They’ve kept the environment in such good condition that if the ditches could drain to the appropriate creeks and rivers and carry fresh rainwater, nature could solve a lot of the E. coli problem the TMDL plan addresses.

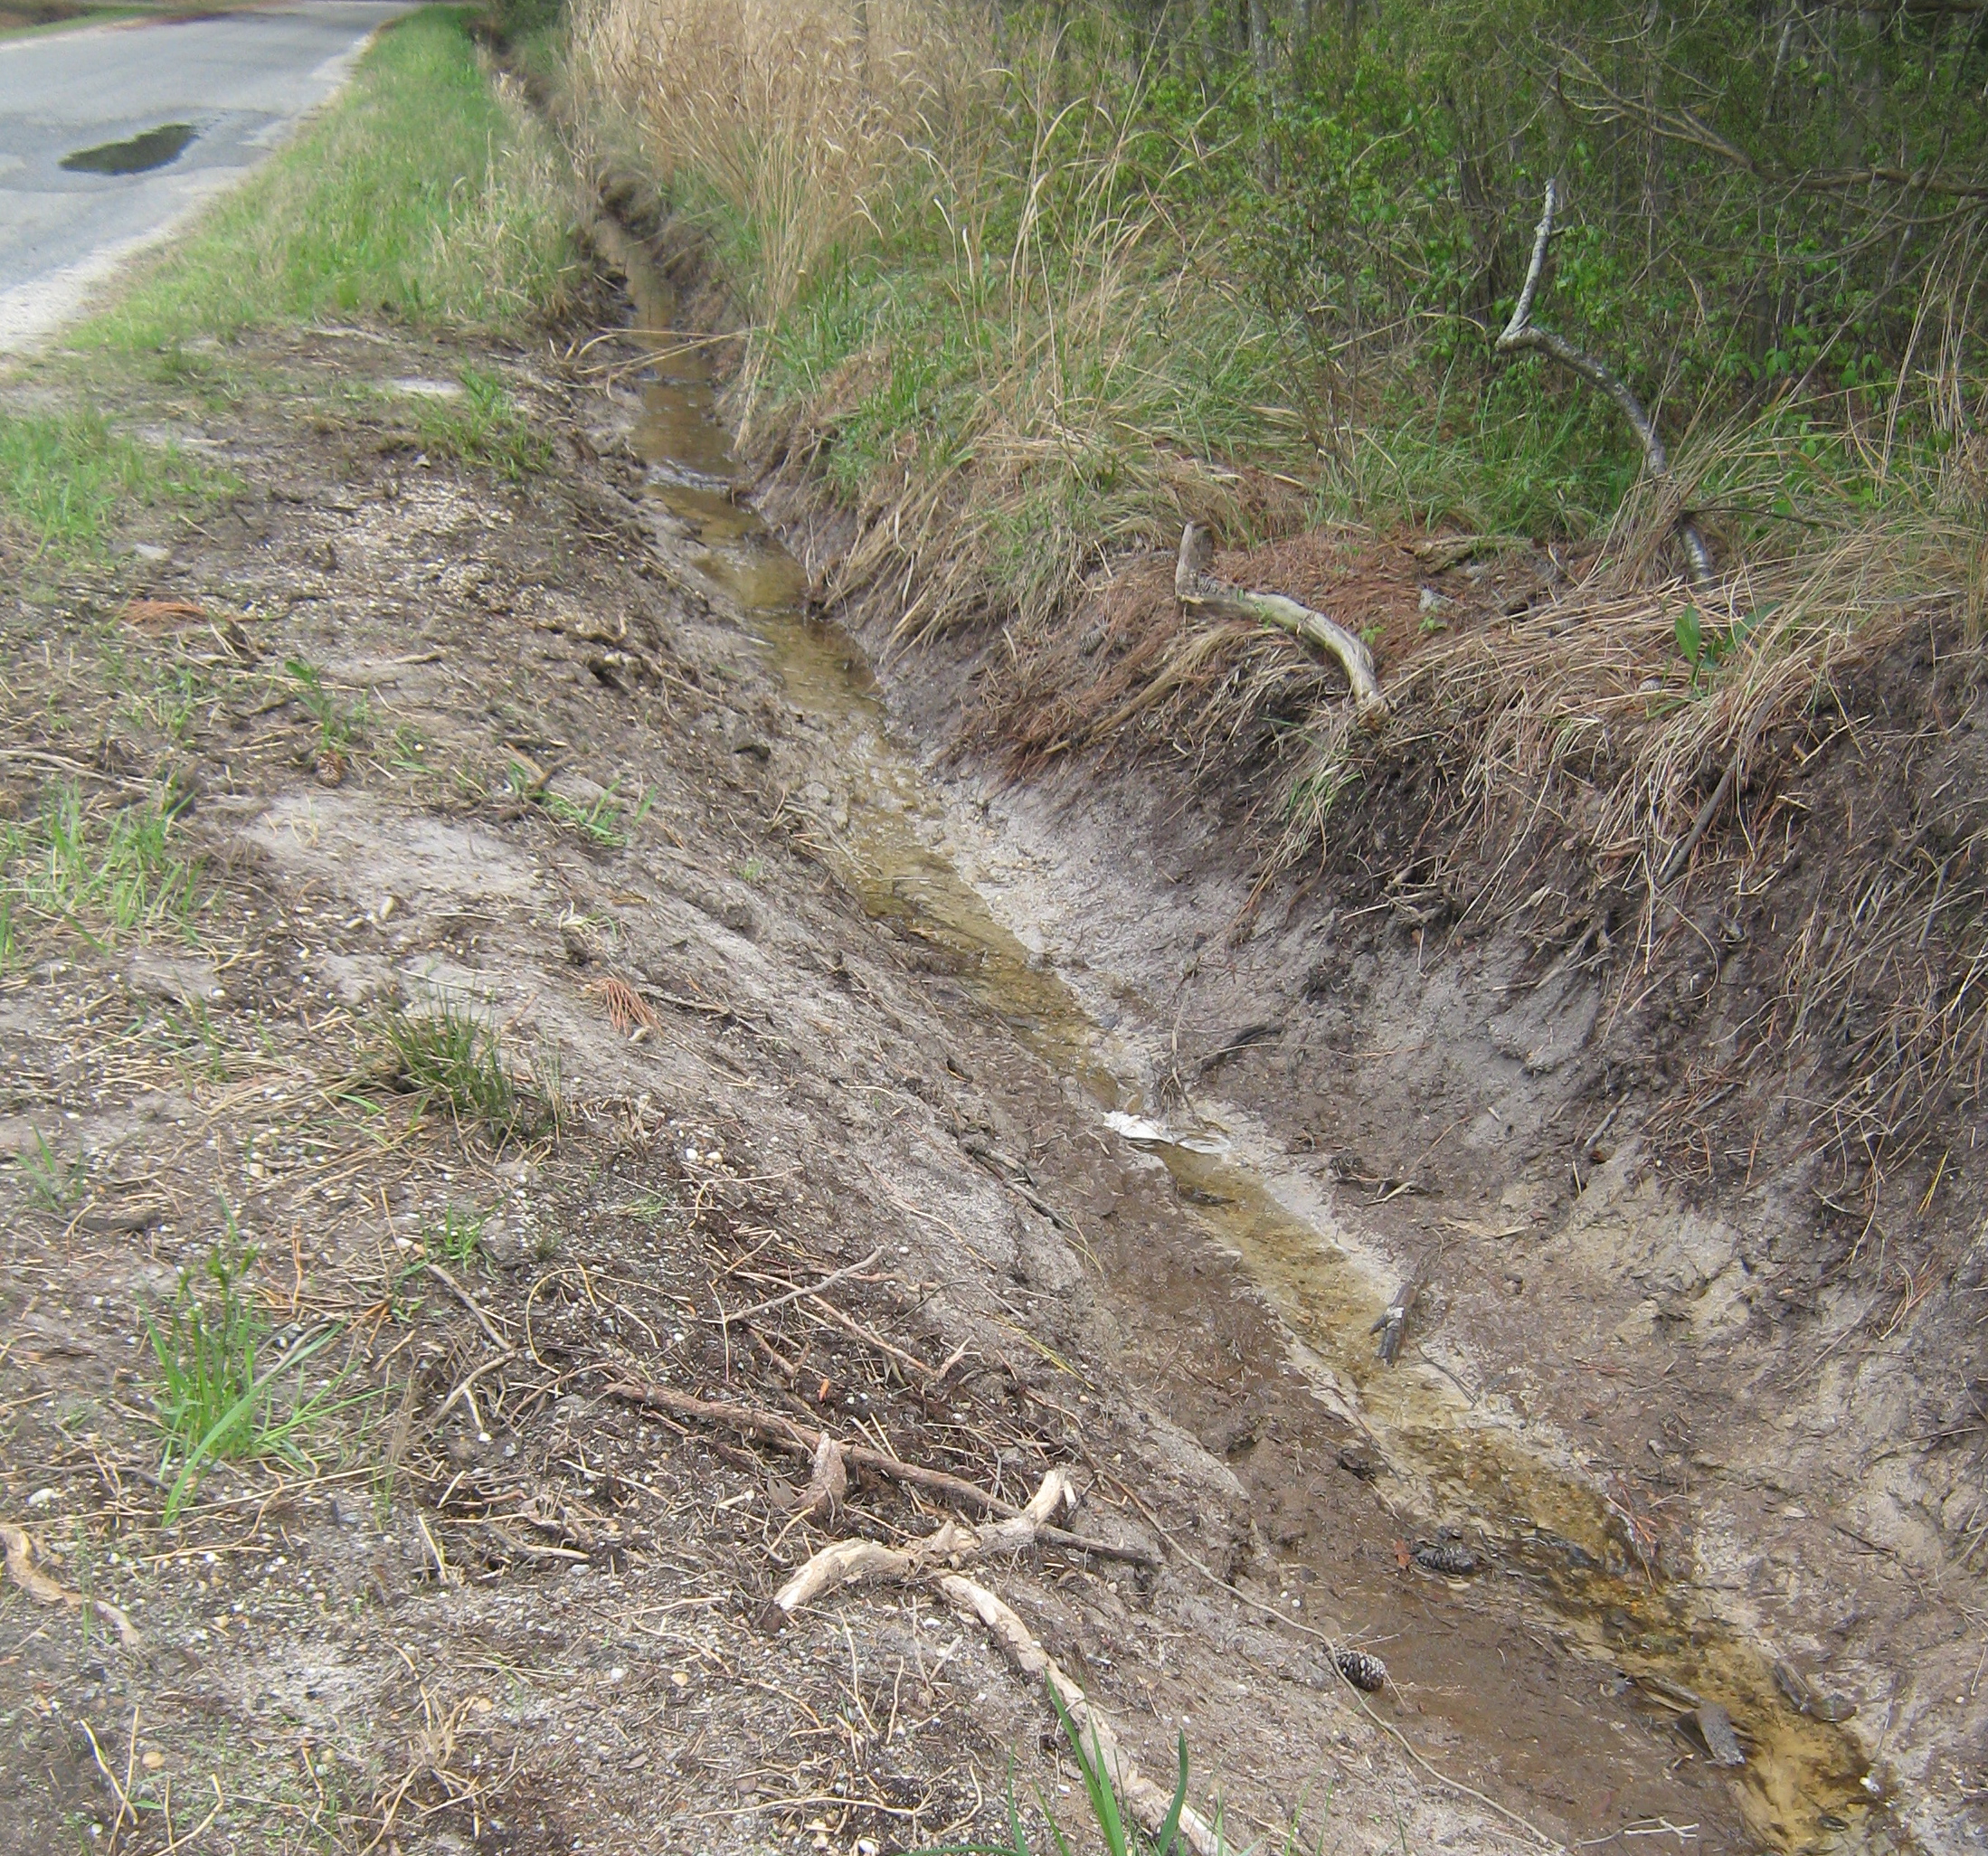
But VDOT mythology turned highway ditches into retention ponds filled with muck and algae and stagnant water.

Algae in flooded ditch with blocked pipe

This spring, VDOT just might realize their mythology has kept the roadbeds saturated and caused more freeze damage  to the roads this winter than they ever imagined.

For me, I’ve made it through the winter and over the despair of feeling I’d taken on an impossible task. Spring is on the way, and Drowning a County is on the way to completion too.

Check out Carol’s Ditches of Mathews County columns at http://ChesapeakeStyle.com.


Public Meeting for Piankatank – Milford Haven TMDL Implementation Plan Feb 27, 2013, 6-8 PM

Mathews High School 9889 Buckley Hall Rd. (Route 198 near 14)

As a result of the the Clean Water Act, we have to show how we’re going to deal with the problem of waters condemned for excessive E. coli bacteria levels in a Piankatank/Milford Haven TMDL Implementation Plan. TMDL (total maximum daily load), is the maximum amount of nitrogen, phosphorus, sediment or bacteria a waterway can handle without exceeding acceptable levels.

We are fortunate here that those before us kept the waters clean, and the only factor we need to address for 16 specific areas* in Mathews, Gloucester and Middlesex is the bacteria in the water. Currently, the recreational standards are met, but not those for shellfish.  While shellfish water standards are much stricter than recreational standards, we don’t have the regulatory option to downgrade the use of our bays, creeks or rivers. Commonwealth policy states “the existing uses shall be maintained and protected.”

The first TMDL public meeting last May in Hartfield brought up a lot of questions and concerns. There were two work group (residential and business) meetings and a steering committee meeting and many emails since then to cover each point and to challenge the numbers and statistics first presented last year. I am very pleased to say that the state agency people from DCR and DEQ took our concerns input to heart and have updated the numbers and facts based on actual counts where available, and best estimates provided by local citizens where exact numbers were impossible. They have also affirmed there is no intention to force us into any HRSD expansions.

We still need to review the Implementation Plan at this public meeting in February, but I believe we can accept and live with the plan.  Please make every effort to attend. This is something that affects all of us in one way or another. If you or a neighbor cannot attend, there is a 30-day comment period after the meeting. At that point, after any changes made as a result of the meeting or comments, the plan is ours to follow for the next 10 years.

*The areas to be covered by this IP, in addition to parts of the Piankatank River, are:
Mathews: Edward and Barn Creeks on Gwynn’s Island; Cobbs, Queen/Winder, Lanes, Stutts, Morris, Hudgins, and Billups Creeks
Gloucester: Harper, Dancing (Dancer), Ferry, French’s Creeks
Middlesex: Wilton, Healy Creeks


MAIN STREET DRAINAGE IMPROVEMENT

DESIGN PUBLIC HEARING

DECEMBER 12, 2012

5-7 PM THOMAS HUNTER MIDDLE SCHOOL

Public Meeting notice in Gazette Journal 11/15/12

The meeting will only cover Main Street drainage from Hyco Corner to Kingston Parish Hall, and comments will be limited to that area.

Wondering why now? Why no mention at the October board meeting? Why no documents are available for inspection in Mathews?

Good Turnout for TMDL Meeting – But We Missed the Part About The Army Corps of Engineers And Oyster Sanctuaries

About 50 people came to the TMDL meeting in Hartfield, including Mathews County Supervisor Janine Burns and Planning Director John Shaw. About the biggest piece of new information was the BST test– bacterial source tracking — is no longer being used to identify the most likely source of fecal coliform contamination. That takes care of concerns over accuracy of the tests, but we don’t know yet how, or if, specific sources can be determined at this point.

As most of those attending expected, septic systems, agricultural practices, livestock and pets were cited as the areas the implementation plan will target. Wildlife, including Canada geese, were initially dismissed as a significant factor, but the residential/recreational workgroup did get a recommendation on record to involve DGIF or other agencies in exploring this aspect of the problem. It’s still unclear why agencies involved with wildlife are not participating in TMDL meetings from the beginning, if only to provide fact sheets and a point of future contact.

The Department of Environmental Quality (DEQ, along with the Departments of Conservation and Recreation (DCR) and Mines, Minerals and Energy (DMME), issued a TMDL Six Year Progress Report for 2000 – 2006, in March, 2007. In discussing the challenges faced in the Metro Richmond area, the report cited: “Wildlife (such as geese, ducks, beaver, & deer) likely contributes to the impairment.  Methodologies to address these sources may need to be explored and evaluated.” (If there are more recent reports about the results of such evaluations, they’ll be reported here as soon as they’re identified.)

Questions about possible discharges from boats caused heated exchanges, as did the question of the necessity to attempt to bring impaired waters up to the strict standards necessary for shellfish cultivation. For Virginia to continue interstate sales of shellfish, there is no option other than for the state to continue to monitor and report on all shellfish shoreline areas and to develop plans to attempt to clear up impaired waters.

The lack of a sound system and projected graphs and charts that were only visible from the front rows added to the charged atmosphere at times, but overall, the meeting was civil, and DEQ and DCR representatives and residents in attendance were able to express their points of view. There were questions left unanswered due to the time restraints, but by the next meeting, answers should be available on all of them.

This process leading to the creation of TMDL Implementation Plans is not going to be quick or easy. Some of the possible BMPs (Best Management Practices) presented at the meeting may be helpful. We’ll know better after these are reviewed and considered in depth.  I do believe the people involved on all sides are sincere and care about the results, and that the IPs will not just be cookie-cutter versions of other IPs. There is a lot of work to be done locally to achieve that result.

But just when I thought we had a sense of how this whole TMDL process works, we learned from a Southside Sentinel article that the Army Corps of Engineers has plans in progress for the Piankatank and other rivers in the Chesapeake Bay watershed in Maryland and Virginia involving oyster sanctuaries, a fairly significant detail not mentioned in the TMDL meeting, and not at all obvious on either the DEQ or DCR websites. I’ve looked at a lot of TMDL related documents the past few weeks, and the Army Corps of Engineers and oyster sanctuaries didn’t pop out anywhere. A quick look at the Norfolk District Army Corps of Engineers website found this image-link:

http://www.nao.usace.army.mil/News/20120329_PublicMeetingsOysterRestoration.asp
to a public meeting notice about “native oyster restoration plans for VA, MD” and that notice said in part, “The long-term goal is to restore an abundant, self-sustaining oyster population that performs important ecological functions such as providing reef community habitat, nutrient cycling, spatial connectivity, and water filtration, among others, and contributes to an oyster fishery.”
Sounds great, except for what I read in the Sentinel article and in a quick look at “The Master Plan.” Guess I have some homework to do this weekend.

Are Year-round Geese Part of the Water Contamination Problem?

Sunset facing mouth of Queen’s Creek courtesy of Davie Cottrell©

Each impaired shellfish area has unique challenges, so this post is only about Queens Creek, which is listed in the 2007 Gwynn’s Island-Milford Haven watershed TMDL report. It states “septic systems should be a primary implementation focus because of health implications….” Like many official statements, it sounds good at first hearing, but if septic systems are failing near Queens Creek, why would the human contamination drop to 0% on any month’s reading, much less for 3 of 6 readings taken between October, 2005 to August, 2006? But Figure 4.6 B shows 74% for the average annual fecal coliform contributions from wildlife.

Residents on Queens Creek have seen the geese population go from staying half the year to settling in year-round. Does that have anything to do with the high wildlife contributions? Can’t tell from the reports because the details aren’t provided, only totals and percentages for ‘wildlife’.

Mouth of Queen’s Creek courtesy of Davie Cottrell©

Other questions are, “Do the geese increase the phosphorus load too? Are they causing any additional shoreline erosion by eating young shoots?”

 And we need to consider whether there are other conditions that  are making the situation worse? Where are the computer models for evaluating the impact of the lack of dredging? The waters in Queens Creek used to be navigable, but they’re not for many craft today. If the Creek is dredged, would more water flow in and out with each tide change the capacity to process the impact of wildlife contamination? How much has settled in the silt at the bottom of the shallower creek to be stirred up by storms? (And on a separate point, if dredged material is spread in the sun, can the natural UV  disinfect it so it would then be usable to nourish the marshes that are being eroded by wave action and storms?)

But as things stand, continual contamination means the waters have no possibility of recovery naturally, so what happens to the areas further downstream?

The report acknowledges that for some areas, “water quality modeling indicates after removal of all of the sources of bacteria (other than wildlife), the stream will not attain standards under all flow regimes at all times. However, neither the Commonwealth of Virginia, nor EPA is proposing the elimination of wildlife to allow for the attainment of water quality standards….The reduction of wildlife or changing a natural background condition is not the intended goal of a TMDL.”

What is their plan? Even if all the effluent, pet and livestock elements are reduced as far as humanly possible, according to the 2007 report, the bottom line is the state agencies don’t plan to do anything–except change the assigned use of the waters–probably permanently.

It’s relatively easy for TMDL plans to go after the obvious 8% human element, 9% livestock and 9% pet contamination the state tests indicate. It’s not going to be easy to deal with the rising population of geese, but information is available about how to address the problem. Now we have to see if our state agencies are going to go beyond the obvious and deal with the 74% of bacterial contamination attributable to wildlife. Wonder if we’ll find out on the 23rd.

TMDLs? Mathews Residents Need To Figure Out How to Play This Numbers Game on May 23, 2012

I don’t think you can find anyone who will say they want dirty, fecal-contaminated water in their rivers, creeks and bays. But there are no easy answers for how to clean them up, or even how to guess how many potential sources there are. Yes, I said guess, because most of the reporting comes from computer modeling based on computer generated land use maps. Short of going out and counting every dog, raccoon, deer and duck, the best we can do is an educated guess.

<<JUST IN: IMPLEMENTATION PLAN SIMILAR TO WHAT WE CAN EXPECT:Greenvale Creek Implementation Plan>>

But we can apply common sense and general knowledge to refine those computer models. We’re on a deadline here: a public meeting has been called for May 23rd at the YMCA in Hartfield, 6:30 – 8:30 pm, for Mathews, Middlesex and Gloucester residents.   DCR Meeting Notice 5-23   It’s up to us to show up and share what we know. We need to question what doesn’t make sense in the old reports too — before the same information is passed along to the plans that will follow this meeting.

Shellfish Factsheet What we know right now is the Department of Environmental Quality defines TMDLs (Total Maximum Daily Load) as “the total pollutant a water body can assimilate and still meet standards.” And there are 9 creeks feeding into the Gwynn’s Island/Milford Haven Watershed or Piankatank River and parts of the Piankatank that are impaired and have levels of fecal coliform bacteria that are too high for growing shellfish.

If more information turns up, I’ll add to this post. Links to the old reports follow, with maps that show the areas involved.  See you at the meeting on the 23rd!

The impaired waters being discussed are located in these VA Dept of Health Shellfish Growing Areas

TMDL Report Gwynn’s Island and Milford Haven Watersheds

Gwynn’s Island and Milford Haven Watersheds shown in green

TMDL Lower Piankatank River

TMDL Modified Report Lower Piankatank River

TMDL Report Upper Piankatank River

5 Creeks in Gwynn’s Island-Milford Haven Watershed With Impaired Shellfish Waters


Wilton, Healy and Cobbs Creeks

Upper Piankatank River and Harper Creek


Wetlands Plant Indicator Categories Changed — and so did the definitions

When I first wrote this story, I was excited that I received a helpful and rapid response from the U.S. Army Corps of Engineers within 3 hours of my emailed inquiry about the 2012 National Wetland Plant List:”Good timing with your message, the National Wetland Plant List (NWPL) has been finalized and a notice was published in the Federal Register today [May 9, 2012]… https://www.federalregister.gov/articles/2012/05/09/2012-11176/publication-of-the-final-national-wetland-plant-list.  The NWPL officially becomes effective on 01 June 2012.”

Loblolly pines are a familiar sight in Mathews

The 2012 National Wetland Plant List shows Pinus taeda (loblolly pine), and   Liquidambar styraciflua (Sweet Gum) as FAC.  FAC used to mean Facultative, equally likely to occur in wetlands or uplands.  I thought that with the new list recognizing plants like loblolly pine and honeysuckle as very adaptable and not limited to wetlands, the same idea would be carried through in the rest of the listings–and future wetlands delineation decisions would be more rational than in the past.

But not only did the panel add 1,472 plants to the original 6,728 species, they changed the definitions of their wetland indicator classifications as well.

OLD OBL – Obligate Wetland: Occurs almost always (estimated probablility 99%) under natural conditions in wetlands.
2012 OBL: Plants that always occur in standing water or in saturated soils

OLD FACW – Facultative Wetland: Usually occurs in wetlands (estimated 67% – 99%), but occasionally found in non-wetlands
2012 FACW: Plants that nearly always occur in areas of prolonged flooding or require standing water or saturated soils but may, on rare occasions, occur in nonwetlands

OLD FAC – Facultative: Equally likely to occur in wetlands or nonwetlands (estimated probability 34%-66%)
2012 FAC: Plants that occur in a variety of habitats, including wetland and mesic to xeric nonwetland habitats but often occur in standing water or saturated soils

OLD FACU – Facultative Upland: Usually occurs in nonwetlands (estimated probability 67-99%), but occasionally found on wetlands (estimated probability 1%-33%)                       
2012 FACU: Plants that typically occur in xeric or mesic nonwetland habitats but may frequently occur in standing water or saturated soils

OLD UPL – Upland: Occurs in wetlands in another region, but occurs almost always (estimated probability 99%), under natural conditions in nonwetlands in the regions specified. If a species does not occur in wetlands in any region, it’s not  on the National list.
2012 UPL: Plants that almost never occur in water or saturated soils

If the new FAC had stayed with “equally likely to occur in wetlands or nonwetlands,” we’d be in good shape. As it is, future delineations are probably going to be wetlands-biased, especially when FACU includes plants that grow in xeric (arid) regions, but also in standing water or saturated soils. They must be counting flash floods after storms to get that one in.

Take a few minutes and read the Federal Register entry. It provides some interesting background information on the comments from those on the reviewing panel who did not agree with the final decisions. Perhaps the planned challenge studies to test the new list will bring some adjustments. And when they set up the system again to search by county, it might be a good idea to download the local listings before visiting a nursery for landscape plants. Save those labels so you know the scientific names of whatever nonwetland plants you add to your plantings.

To leave you on a pleasant note, these are mountain laurel, Kalmia latifolia – FACU, growing in Mathews, and they aren’t in standing water or saturated soil.

Mountain Laurel (Kalmia Latifolia)  FACU

Mountain Laurel (Kalmia latifolia) FACU

New Point Comfort Development Company’s Plans: A Mathews Resort – But Only On Paper

The last post showed this Wetlands Watch slide used in a Middle Peninsula Planning District Commission presentation.

It’s true you’ll find water and some marshes today where the lots were shown on a 1904 Mathews County subdivision map near the lighthouse. But what the MPPDC/Wetlands Watch slide doesn’t say is the development company planned to fill in the tidal marshes and bring in sand to create beaches. The New Point Comfort Lighthouse site online says that the enormous cost to carry out that plan is what caused the company to go out of business the following year.

New Point Comfort Development Company Subdivision Plan – 1904


So what happened to the tidal marshes, sandbars and shoaled areas that existed in 1904 and earlier? And what about the photos and stories of people a generation or two ago who went to sandy beaches at New Point for picnics and outings?

Sand moves with the wind and waves. It is washed away, and bars and beaches reform at another place if there’s enough material available. But major storms can play havoc with that process. The Office of Naval Research describes one kind of current along the coast called the Longshore Current, how it moves, and how it can cause powerful and dangerous rip currents.

There’s an animation of the wave action that can produce sandbars on ONR’s educational Science and Technology Focus website at: http://www.onr.navy.mil/focus/ocean/motion/currents2.htm

With hurricanes and some other storms, the low pressure system increases the speed of longshore currents and height of waves. When these stronger longshore currents produce rip currents, they excavate channels through sandbars. The sand then accumulates in a quieter areas forming new bars. In this way, depending on the number and types of storms, and the intervals between storms, sandbars appear to migrate. When sand is exposed and dry, the wind then moves it to build up beaches–or blow them away. Beaches can only build up when dry sand is available. If the angle of a beach changes, so that the sand remains wet, the beach will not grow and can be diminished by wave action or the effects of storms.

The Chesapeake – Potomac Hurricane of August 23rd, 1933 and the one that hit on September 16th, 1933  ripped through the area around New Point Comfort, leaving two separate islands we see today. But the New Point Comfort Lighthouse withstood the tremendous winds and rain and waves, and isn’t that the story that really matters?


The Shoreline’s Moved 1/2 Mile–if Sandbars Count as Shoreline

The shoreline that moved was mostly sandbars washed away by storms and waves.

This slide was used in a Middle Peninsula Planning District presentation at a  Virginia Coastal Partners Workshop in 2010.  An eye-catching headline, a dramatic image, a subhead intended to reinforce an idea. Wetlands Watch supplied MPPDC with the image, and both organizations used the same picture in separate presentations at the same workshop.

Wetlands Watch used the line, “Climate Change Impacts Can be Seen in Virginia” along with “From 1885 to now–the shoreline has moved 1/2 mile.” The banner across the center of the MPPDC slide says: “THIS PROVES NOTHING!!” To which I can definitely say, You’re right!  This doesn’t prove any sea level rise; it doesn’t prove climate change; and there’s a lot more to this story.

Virginia Institute of Marine Science (VIMS) did a site assessment of the New Point Comfort Lighthouse in 2008, and they noted that “erosion has always been an issue at the New Point Comfort.” The lighthouse was built on a peninsula connected to the mainland by a sandbar. Between the time the lighthouse was built in 1804 and 1832, immense areas of sand had been moved by storms, waves and wind. What follows here is the story of what was done to try to protect the lighthouse during those years, not from rising water levels, but from the relentless scouring of sand from the lighthouse island by waves and wind and storms.

The keeper reported after the Great Coastal Hurricane of 1806 that “a considerable part of the beach washed away & one of the landmarks <indicating the boundaries> was washed up, that was at the distance of 45 feet, when the public land was laid out from highwater mark.”(Candace Clifford, New Point Comfort Light Station – Historical Documentation, 2001) “This hurricane, due to its slow movement and consequent erosion of the coastline completed the formation of Willoughby Spit. A seawall built to prevent further erosion at Smith Point Lighthouse was damaged.” (http://www.hpc.ncep.noaa.gov/research/roth/vaerly19hur.htm)

In 1814, the first report of the extensive damage the British did to the lighthouse in the War of 1812 suggested the lighthouse should be destroyed if the war continued because it was being used as a watchtower, and “the water already washes its base and in a few years will undermine it.” (Clifford, 2001 quoting from the National Archives.) That advice was not followed and in 1815, the original builder recommended 156 pilings of 12-14 ft be sunk 5-6 ft in the sand, and another 100 opposite the house to protect it.

A year later, sand had begun to collect around the pilings and the lighthouse was considered secure. Unfortunately, by 1822, those pilings had rotted in the ground. A stone wall was then approved in 1825, and still more repairs and additional work were done in 1832.

The National Archives holds a request for a boat in 1839 because, “There is now two miles of water communication necessary where until lately there was a ford at low tide.”  In 1846, the keeper reported the “publick buildings were completely surrounded by tidewater.” (Candace Clifford, 2001)

The lighthouse was put out of commission during the War Between the States in 1861, restored in 1865, and once again, a boat was requested for the keeper in 1866. Sand moved and shoals formed in the decades that followed, and gales and hurricanes moved and changed them as they always have. But that’s a function of weather, normal, ordinary weather–capricious and unpredictable, not because of climate change.

The next post will take a look at what happened to the 1904 1,000 lot subdivision of the New Point Comfort Development Company. Or, perhaps more accurately, what didn’t happen.

*   *   *

Below is a detail from NOAA Nautical Chart 12238, showing water depth in feet in 2009 around New Point Comfort Lighthouse island. (Green areas are marshes.) One small area to the northwest, between the lighthouse and the shoreline is 5 ft as the MPPDC/Wetlands Watch slide said, but north, past a marshy area, it’s 1 ft; to the northeast, 1/2 ft, and east-northeast, 2 ft.


The New Point Comfort Lighthouse

New Point Comfort Lighthouse, date unknown, possibly late 1800’s


The New Point Comfort Lighthouse is on an island off the southern tip of Mathews County. It’s the 3rd oldest lighthouse surviving in the Bay, the 10th oldest in the Country, and it’s on the National Register of Historic Places. Efforts are underway to preserve it for the future. (Photo courtesy of the U.S. Coast Guard and the National Archives.)

There’s a great video and a lot of information here: http://www.newpointcomfortlighthouse.org/

There’s also a concise and well-written history on the Lighthouse Digest site:  http://www.lhdigest.com/Digest/StoryPage.cfm?StoryKey=2304

Photo on Ten Mile Hill shows the effect of liquifaction where the intense shaking caused the water to rise and mix with the sand, forming a craterlet with puddled water at the bottom after the shaking stopped.

The lighthouse was completed in 1804, and has survived a number of storms, the War of 1812, and the Charleston Earthquake of August 31, 1886, which shook seven states from South Carolina to New York. Aftershocks  continued for days afterwards, but the lighthouse withstood them all.

(Photo courtesy of U.S. Geological Survey; Photo by C.C. Jones, September 1886. Plate 20, U.S. Geological Survey Annual Report 9, 1887-88)

Currently, the lighthouse is being used as an example of the imminent danger from sea level rise caused by global warming. My next post is going to show why that’s not quite the case.