VDOT: Get the Water Moving for the Oysters

If the Virginia Department of Transportation won’t maintain adequate drainage from state highway roadside ditches to avoid flooding of private property and timber, maybe they’ll do it to provide adequate oxygen in Chesapeake Bay area waters for the oysters. Following up on yesterday’s post, this one provides information about a Smithsonian Environmental Research Center (SERC) study and where to find it online.

A Smithsonian Institution press release in February 2015 announced publication of an article, Landscape-Level Variation in Disease Susceptibility Related to Shallow-Water Hypoxia. The details may be more than the casual reader wants to absorb, but the bottom line is the SERC study describes how oysters in Chesapeake Bay area waters are more susceptible to disease when they are exposed to episodes of low dissolved oxygen at night. The locations studied had a depth of less than 6.5 feet and salinity levels typical of many of the shellfish waters around Mathews County.

“We usually think of shallow-water habitats as highly productive refuges from deep-water dead zones,” says Denise Breitburg, marine ecologist at SERC and lead author of the study. “But if low oxygen makes even these shallow waters inhospitable for fish and shellfish, the whole system may suffer.”

 So VDOT, if you don’t care about the impact on people, get the water moving so our oysters can remain healthy and help clean up the mess your negligence created.


Article Source:Landscape-Level Variation in Disease Susceptibility Related to Shallow-Water Hypoxia

Breitburg DL, Hondorp D, Audemard C, Carnegie RB, Burrell RB, et al. (2015) Landscape-Level Variation in Disease Susceptibility Related to Shallow-Water Hypoxia. PLoS ONE 10(2): e0116223. doi: 10.1371/journal.pone.0116223

Time to Pay Attention to Oxygen for the Bay

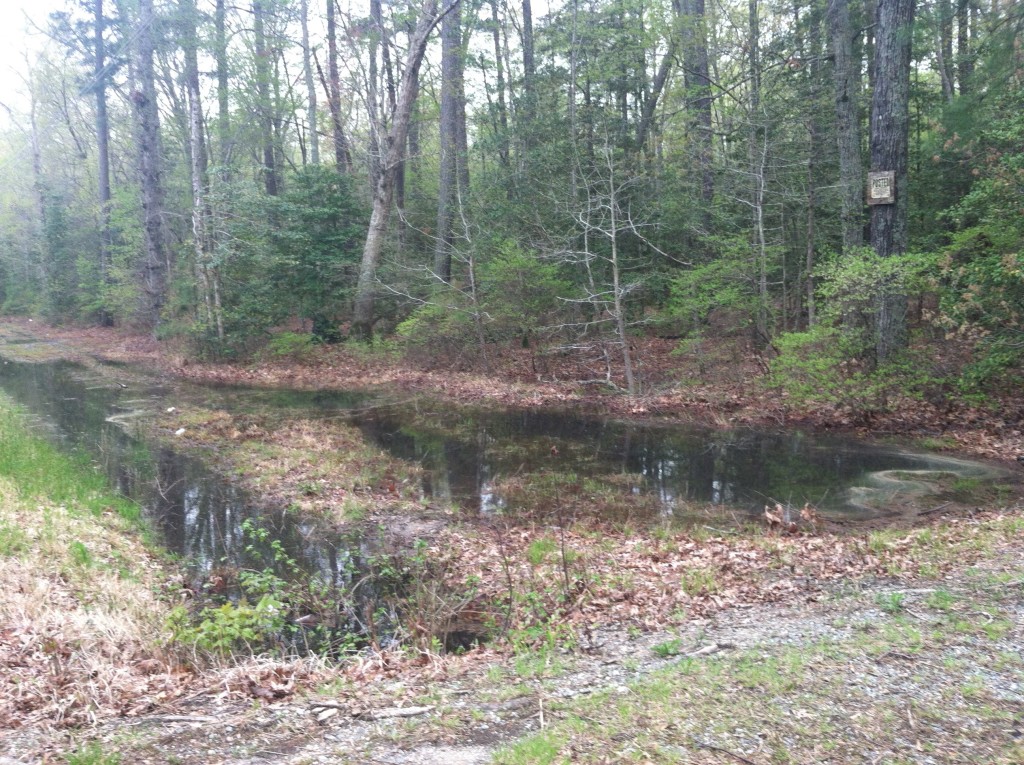
Blocked VDOT roadside ditch flooding adjacent land.

Blocked VDOT roadside ditch flooding adjacent land.

I wrote a report in 2012. If anyone in authority had paid attention then, we’d be seeing results now, instead of looking at more flooded ditches and damaged roads. Expect our TMDL numbers (total maximum daily load) for E. coli levels to stay the same, because the problem is not primarily land-based. It’s VDOT ditch based.

Although nothing about dissolved oxygen levels made it into the final EPA-accepted Water Quality Improvement Plan, there was a recommendation for a Ditch Task Force involving the Virginia Department of Transportation. The intent was to discuss and plan ways to improve the drainage for our state roads. Instead, we have the Middle Peninsula Planning District Commission advocating the creation of a Ditching Authority to charge landowners and counties for VDOT’s failures.

MPPDC is basing its Ditching Authority concept on states and countries which drained wetlands for agricultural purposes–and must continue to drain them to continue farming. Ohio, for example, drained 7.4 million acres of wetlands, and today, 2/3s of their cropland and 500,000 homes depend on that land staying drained. They have a Ditching Authority.

Our drainage problem is rainfall from state roads cannot reach receiving bodies of water because of failed and neglected VDOT maintenance. The cause is not wetland drainage, not agricultural land drainage, not private property drainage, not sea level rise, not land elevation or land subsidence.

Read the report and see for yourself if it makes sense.

Report for Working Groups for the Shellfish TMDL Implementation Plan for the Piankatank River, Gwynns Island and Milford Haven Watersheds, August 27, 2012

submitted by Carol J. Bova

A review of the original Shellfish Sanitation Surveys and outstanding violations for the Piankatank River, Gwynns Island and Milford Haven Watersheds doesn’t document enough ongoing septic system violations to account for the continuing high levels of bacteria in the TMDL waters. From the June 30th report, only Healy Creek had one prior uncorrected septic issue. There were two kitchen deficiencies: one at Healy Creek and one at Edwards Creek.

There are no large agricultural operations, fewer farms than decades ago when the waters were not impaired, and not enough hobby livestock to account for current bacterial impairments. It’s equally unlikely that pets are the main factor, and while wildlife contributes a significant amount, it is not the sole source.

Based on scientific findings over the last six years across the United States, in Canada and in Europe, naturalized E. coli is the most likely major source of the ongoing high bacterial readings.

These studies show E. coli does not require a human or animal host to survive for extended periods in soil, sand, sediments and water. Wind and storms stir up sand and sediment and release bacteria back into the water column. Bottom feeding fish like spot and croaker can take in E. coli while feeding and become carriers. Studies in Michigan show E. coli can survive 5 months in water as long as the temperature is above 39 degrees Fahrenheit. Average water temperatures for the TMDL areas only go below that in January and February and may not go that low in some years. E. coli doesn’t only survive on its own–it can reproduce if it has adequate carbon based nutrients. The presence of muck, which is partially decomposed vegetation, provides that nutrition and shelters E. coli, because no sunlight can get through it. It takes four days of sunlight to kill E. coli.

Part of the key to eliminating E. coli in the TMDL waters is to get the water clear enough to allow sunlight to penetrate. The plan to restore oysters is intended to do that, as well as filter the water, but oysters can’t live in the muck and must be suspended above it. The headwaters and some of the small inlets of the creeks are among the worst areas, with heavy muck, little circulation and probably low levels of dissolved oxygen in the water which must be addressed before oyster placement. Submerged aqueous vegetation will also benefit from more sunlight.

The long-term goal of restoring oysters is solid, but needs to be backed up with a multi-layered approach to cleaning up the waters, with a plan tailored to the characteristics of each TMDL segment. In Queens Creek, for example, at least 3-4 feet of muck exists on the sides of the channel, possibly more in the center. If the channel could be dredged to remove most of that muck, the creek could then be treated with probiotic decomposer bacteria to help break down what remains. This would create a more favorable environment for oysters and other water animals and allow sunlight to reach deeper into the water, killing even more E. coli.

Using small aeration units attached to private docks to provide additional oxygenation has been tried in Maryland. William Wolinski of Talbot County Maryland Dept. of Public Works stated the aeration used there from May through October created ‘oxygen sanctuaries’ for fish and other creatures and allowed positive bacterial action to break down sludgy sediment. A simple unit costs about $500-$600 and covers 1/4 acre placed at a 4′ depth according to one manufacturer. Any aeration provided will improve the action of probiotic bacteria in decomposing muck sediments.

Before any direct action is taken in TMDL creek headwaters and inlets, the Virginia Department of Transportation roadside ditches and related outfall ditches leading to those waters must be cleaned, pipe blockages cleared and overgrown vegetation removed to allow clean rainwater to reach the waterways. Currently, the water in outfall ditches is deoxygenated by decaying plant matter and has little to no flow except during storm events. Major storms flush the stagnant water into areas leading to the headwaters, and the load of rotting vegetation and silt with it adds to the mucky sediment already present.

The Virginia Department of Transportation should be named a stakeholder in the TMDL Implementation Plan for low dissolved oxygen levels in water in ditches which connect to TMDL waters. Credit trading should not be an option because the actions required to improve oxygenation fall within normal roadside maintenance and budget. DCR and DEQ staff can support citizen requests for a VDOT 5-year plan for roadside and outfall ditch maintenance to provide an outlet to an adequate receiving channel and body of water as required by VDOT Drainage Manual policies. This will allow clean, oxygenated rainwater to reach TMDL waters, giving other measures a better chance of success.

Sharing What We Learned About VDOT Myths and Mathews Drainage

Since the fall of 2011, I’ve been digging into the reasons for flooded land and ditches in Mathews. G.C. Morrow taught me the basics of ditches and we formed The Ditches of Mathews County project in early 2012.  We thought identifying the causes of drainage issues and working out solutions would help VDOT. When VDOT said they needed temporary easements to address outfall maintenance, we tracked owners through tax records and internet resources. G.C. visited local folks and called some who lived in other states. All were glad to help. But apparently, VDOT had other ideas.

Two small outfalls were cleaned on 609, and the water drained a considerable area that had been flooding from road drainage for years. The third project opened the outfall between Canoe Yard Trail and 609, but in the process, the VDOT contractor blocked the outlet to a second outfall. Months passed, and after the District Administrator Quintin Elliott and Resident Engineer Sean Trapani accompanied us on a tour of problem spots, VDOT finally addressed a dead tree preventing the roadside ditch on Canoe Yard Trail from draining to the outfall. But the cleaning of 609 pipes needed to drain the roadside ditches near the tidal marshes didn’t happen. The one time we know the pipe truck arrived–it came at high tide. And never came back to do the job.

We kept working on gathering information, and the story that emerged was not a pretty one. Going through the Board of Supervisors’ meetings, month after month for thirty-odd years was a test of endurance. Transcribing key sections and sorting by topic and choosing which statements would illustrate the ongoing saga felt like an impossible task for a time. Eventually, though, the outline emerged showing how three years of VDOT/County revenue sharing projects ran on into the sixteenth year, and how those involved seemed to forget the original reason for the projects.

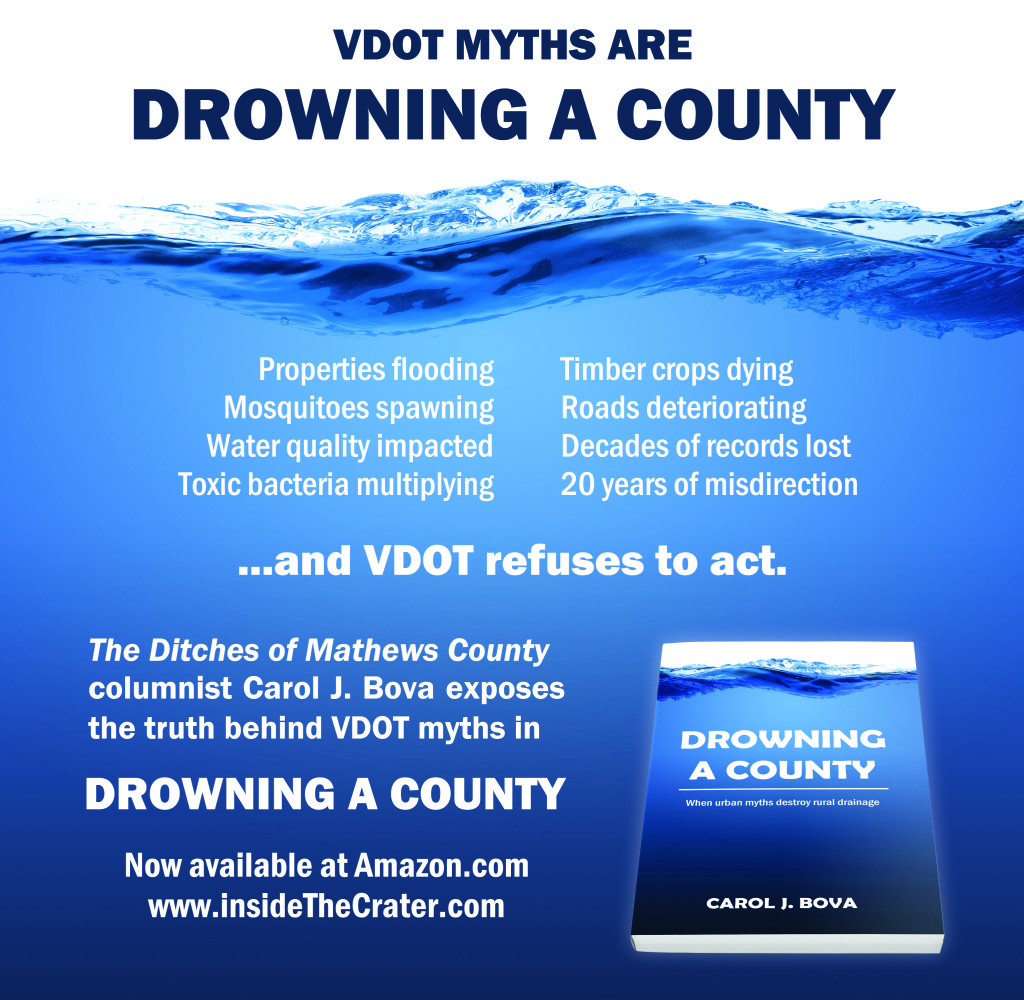
It’s all laid out now in Drowning a County, and everyone reading it will see what happened and when, and more importantly, what didn’t happen that should have. The pattern of County Supervisors and Administrators forgetting or overlooking details of agreements with VDOT and accepting incorrect statements without challenge cannot be allowed to repeat itself now and in future years. Drowning a County can provide the facts and the history to help our leaders and our citizens avoid being misled even once more by VDOT mythology.


Things That Make You Go Hmmmm… Gov. McDonnell on Virginia’s Oyster Harvests

How does this glowing report connect with the US Army Corps of Engineers Native Oyster Restoration Plan? Will the USACE Plan change the outlook for Virginia?  Read the Governor’s announcement below, then take a look at the Executive Summary of the USACE Master Plan: http://insidethecrater.com/?p=295

Virginia’s Oyster Harvests Boom
– 2011 Harvest was the Best Since 1989; 2012 Harvest May be Largest in 25 Years  –

Over Past Decade Harvest Increases Ten-Fold: from 23,000 bushels in 2001 to 236,000 bushels in 2011; Dockside Value of Harvest Increased from $575,000 to $8.26 million

February 07, 2012

NEWPORT NEWS – Governor Bob McDonnell announced today that Virginia’s oyster harvest has skyrocketed over the past decade, a boom fueled through the Virginia Marine Resources Commission’s use of a rotational harvest system, sanctuaries and targeted shell plantings on public oyster grounds. Over the past decade, the oyster harvest in Virginia has increased ten-fold, from 23,000 bushels in 2001 to 236,000 bushels in 2011. In that time, the dockside value of the oyster harvest increased from $575,000 to $8.26 million. In fact, last year’s oyster harvest in Virginia was the largest since 1989.

Speaking about the growth in the harvest, the Governor noted, “Virginia oysters are not only delicious, they are also profitable. Our oysters are hitting tables all across the nation and the world, on the half-shell, fried, steamed, roasted and in stew. Whether they be Stingrays, Chincoteagues, Lynnhavens, or any kind of Virginia oyster, they are in demand. The incredible growth in our oyster harvests is bringing in new revenue to the state, and creating new jobs for our citizens. I applaud the actions of previous gubernatorial Administrations which have helped Virginia oysters to make such a vigorous comeback, and we are committed to furthering the growth of this local industry in the years ahead. And, I would also note, nothing goes better with a half-dozen Virginia oysters on the half-shell than a glass of Virginia Viognier, the signature white wine of the Commonwealth.”

“The strides made have been remarkable, and indications are this year’s harvest may be the best we’ve seen in 25 years,” said VMRC Commissioner Steven G. Bowman. “It can get even better if we stay the course and continue to spend the funds necessary to maintain our current level of productivity.”

That harvest level remains a far cry from the 1960s, when annual harvests of more than 1 million were commonplace. That was before two diseases, Dermo and MSX, spread throughout the Chesapeake Bay. The diseases do not harm humans, but kill oysters when they reach market size, around three years of age.

Over the decades, VMRC tried numerous approaches to combat the affect of those diseases on the oyster harvest and oyster stocks, with little to no success. But a new management scheme enacted four years ago has shown some impressive results.

Some harvest areas have been put on rotational management plans. They work like this: Harvest areas are opened on a staggered basis for one harvest season then closed for one or two years in order to give oysters a chance in those areas to grow to market size. Individual harvest area openings are staggered on a two or three year rotational basis. This allows harvests in some areas while others remain closed so the oyster stocks can regenerate and be reopened later, in time to harvest the market-sized stocks before the diseases kill them.

Combined with annual pre-season stock surveys, permanent oyster sanctuaries to act as broodstock, mid-season monitoring with stock updates as necessary, and planting oyster shells on public oyster grounds with available state funds, this proactive oyster management regime is paying off.

VMRC’s Dr. Jim Wesson estimates every $1 spent by the state to plant oyster shell yields $7 in economic benefits in the form of larger harvests, and increased jobs for oyster shuckers and oyster packing houses.

Over the past four years of rotational harvests, the harvest off public oyster grounds has almost tripled, from 36,000 bushels to 99,000 bushels last year.

In that time, the total oyster harvest – including privately leased oyster grounds and oyster farming operations – has grown from 95,000 bushels in 2008 to 236,000 bushels in 2011. That’s an increase in dockside value from $3.5 million to $8.26 million in just the past four years.

The ripple effects through the economy from last year’s harvest resulted in roughly $22 million in economic value, using a multiplier of 2.63 on a dockside value of $8.26 million, a formula established by Virginia Institute of Marine Science seafood industry economist Dr. James Kirkley.

“This oyster management plan is working,” said Kim Huskey, Executive Director of the Virginia Seafood Council. “This shows the fantastic results that can be achieved with VMRC and the seafood industry working together. For every $1 the state allocates to shell planting on public oyster grounds, $7 in economic benefits accrue. Last year’s harvest resulted in an economic impact of $22 million. This means jobs and economic benefits for Virginia. And it can get even better in the years to come.”

A chart of Virginia oyster ground production since 1957 is available here: http://www.governor.virginia.gov/utility/docs/Virginia%20Oyster%20Ground%20Production%20History%20as%20of%202011.PDF

Will the USACE Plan make things better for Virginia? http://insidethecrater.com/?p=295


Important Reading: Executive Summary Chesapeake Bay Oyster Recovery Master Plan March 2012 Draft

After you read this summary, take a look at Gov. McDonnell’s Feb 7 press release:  http://insidethecrater.com/?p=316

Virginia’s Oyster Harvests Boom
– 2011 Harvest was the Best Since 1989; 2012 Harvest May be Largest in 25 Years  – Over Past Decade Harvest Increases Ten-Fold: from 23,000 bushels in 2001 to 236,000 bushels in 2011; Dockside Value of Harvest Increased from $575,000 to $8.26 million

 How would the USACE Oyster Restoration Master Plan really affect Virginia?
U.S. Army Corps of Engineers 

DRAFT 

Chesapeake Bay Oyster Recovery:
Native Oyster Restoration Master Plan

March 2012

Forward 

The State of Maryland and the Commonwealth of Virginia are the local sponsors for this study. As such, the native oyster restoration master plan (master plan) was prepared in close partnership with the Maryland Department of Natural Resources (MDNR) and the Virginia Marine Resources Commission (VMRC). The National Oceanic and Atmospheric Administration (NOAA), the U.S. Fish and Wildlife Service (USFWS), and the U.S. Environmental Protection Agency (EPA), The Nature Conservancy (TNC), the Potomac River Fisheries Commission (PRFC), and the Chesapeake Bay Foundation (CBF) are collaborating agencies for the project.

EXECUTIVE SUMMARY

The eastern oyster, Crassostrea virginica, helped shape the Chesapeake Bay and the people that have settled on its shores. The demise of the oyster in the 20th century culminated from a combination of overharvesting, loss of habitat, disease, and poor water quality. The problems faced by the oyster in the Chesapeake Bay are not uncommon along the Eastern Seaboard of the United States (Jackson et al. 2001; Beck et al. 2011). However, oyster restoration in the Chesapeake Bay has proven challenging. Past restoration efforts have been scattered throughout the Bay and have been too small in scale to make a system-wide impact (ORET 2009). Broodstocks and reef habitat are below levels that can support Bay-wide restoration, and critical aspects of oyster biology, such as larval transport, are only beginning to be understood. However, even in their current state, oysters remain an important resource to the ecosystem, the economy, and the culture of the Chesapeake Bay region that warrant further restoration efforts. Comprehensive oyster restoration is paramount to a restored Chesapeake Bay. This native oyster restoration master plan (master plan) presents the U.S. Army Corps of Engineers’ (USACE) plan for large-scale, concentrated oyster restoration throughout the Chesapeake Bay and its tributaries.

This master plan represents the culmination of a highly intensive, transparent, and exhaustive effort to bring together state-of-the-art science, on the ground experience, and collaborative planning focusing on native oyster restoration in the Chesapeake Bay into one comprehensive and coordinated document. This effort, which builds on USACE’s Final Programmatic Environmental Impact Statement for Oyster Restoration Including Use of Native and/or Non-Native Oyster in 2009 (http://www.nao.usace.army.mil/OysterEIS/FINAL_PEIS/homepage.asp), is unprecedented in that it lays out the first comprehensive Bay-wide strategy for large-scale oyster restoration. Development of the document and the approaches laid out herein were accomplished painstakingly and with a thoroughness of purpose that this complex restoration challenge deserves. The authors and collaborators sought out the most up-to-date and credible sources of information to inform decision-making and plan formulation, including peer reviewed publications, and scientific and technical work accomplished by Bay experts, state partners, Federal collaborating agencies, non-government agencies, numerous stakeholders, and others with interest or expertise in native oyster restoration. Critical and controversial topics were isolated by the project team and analyzed through a series of Technical White Papers that were vetted among USACE, the project sponsors, and collaborating agencies. Intensive agency technical review of this document was accomplished by USACE with complementary reviews by other Federal and state partners to ensure technical quality and to address the full spectrum of technical and institutional concerns. Further public review of this document will complement the sound technical and institutional foundation on which this document has been built.

USACE, Baltimore and Norfolk Districts, have the authority under Section 704(b) of the Water Resources Development Act of 1986 (as amended by Section 505 of WRDA 1996, Section 342 of WRDA 2000, Section 113 of the FY02 Appropriations Act, Section 126 of the FY06 Appropriations Act, and Section 5021 of WRDA 2007) to construct oyster reef habitat in the Chesapeake Bay and have been designated as co-leads with the National Oceanic and Atmospheric Administration (NOAA) to achieve oyster restoration goals established by the Chesapeake Bay Protection and Restoration Executive Order (E.O. 13508) (May 15, 2009).

USACE restoration efforts have been ongoing in Maryland since 1995 and in Virginia since 2000. In recognition that a more coordinated Bay-wide approach is needed to guide USACE’s future Chesapeake Bay oyster restoration efforts and the investment of federal funding, USACE’s Baltimore and Norfolk Districts partnered with multiple agencies to create a joint Bay-wide master plan for oyster restoration efforts. Federal involvement is warranted due to the magnitude at which oyster populations have been lost in the Bay; the significant role oysters play in the ecological function of the Bay, as well as the socio-economics, culture, and history of the region; and the challenges confronting successful restoration. The purpose of this master plan is to provide a long-term strategy for USACE’s role in restoring large-scale native oyster populations in the Chesapeake Bay to achieve ecological success. It is conceivable that the master plan will serve as a foundation, along with plans developed by other federal agencies, to work towards achieving the oyster restoration goals established by the Chesapeake Bay Protection and Restoration Executive Order (E.O. 13508).

The master plan is a programmatic document that: (1) examines and evaluates the problems and opportunities related to oyster restoration; (2) formulates plans to restore sustainable oyster populations throughout the Chesapeake Bay; and (3) recommends plans for implementing large-scale Bay-wide restoration. The document does not identify specifically implementable projects.

The long-term goal or vision of the master plan is as follows:

Throughout the Chesapeake Bay, restore an abundant, self-sustaining oyster population that performs important ecological functions such as providing reef community habitat, nutrient cycling, spatial connectivity, and water filtration, among others, and contributes to an oyster fishery.

USACE recognizes that self-sustainability is a lofty goal. It will require focused and dedicated funding and strong political and public support over an extended period, likely decades. It will require the use of sanctuaries and the observance of sanctuary regulations. In addition to the long-term goal, the master plan defines near-term ecological restoration and fisheries management objectives. The ecological restoration objectives cover habitat for oysters and the reef community as well as ecosystem services.

The master plan lays out a large-scale approach to oyster restoration on a tributary basis and proposes that 20 percent to 40 percent of historic habitat (equivalent to 8 percent to 16 percent of Yates/Baylor Grounds) be restored and protected as oyster sanctuary. The concentrated restoration efforts are necessary to have an impact on depleted oyster populations within a tributary. To accomplish tributary-level restoration, the master plan includes salinity-based strategies to address disease and jumpstart reproduction.

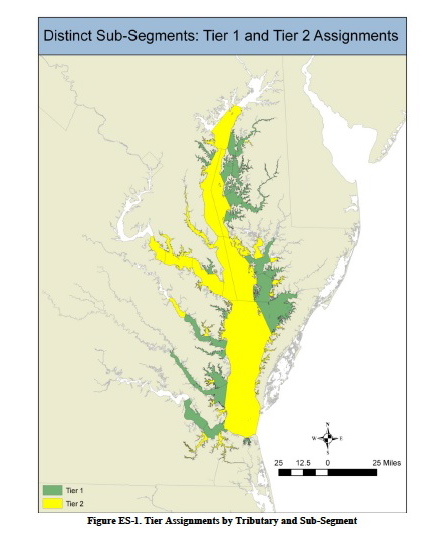
USACE and its partners evaluated 63 tributaries and sub-regions for their potential to support large-scale oyster restoration using salinity, dissolved oxygen, water depth, and hydrodynamic criteria. Salinity largely controls disease, predation, and many other aspects of the oyster life cycle and by its consideration, the master plan indirectly addresses these other factors. The evaluation was largely performed using geographic information system (GIS) analyses. The master plan identifies that 19 (Tier 1) tributaries in the Chesapeake Bay are currently suitable for large-scale oyster restoration (Table ES-1). These tributaries are distributed throughout the Bay with 11 sites in Maryland and eight sites in Virginia, as shown in Figure ES-1. Tier 1 tributaries are the highest priority tributaries that demonstrate the historical, physical, and biological attributes necessary to provide the highest potential to develop self-sustaining populations of oysters. The remainder of the tributaries and mainstem Bay segments are classified as Tier 2 tributaries, or those tributaries that have identified physical or biological constraints that either restrict the scale of the project required or affect its predicted long-term sustainability. The master plan also discusses additional criteria that should be investigated during the development of specific tributary plans such as mapping of current bottom substrate, sedimentation rates, and larval transport and provides a framework for developing specific tributary plans.
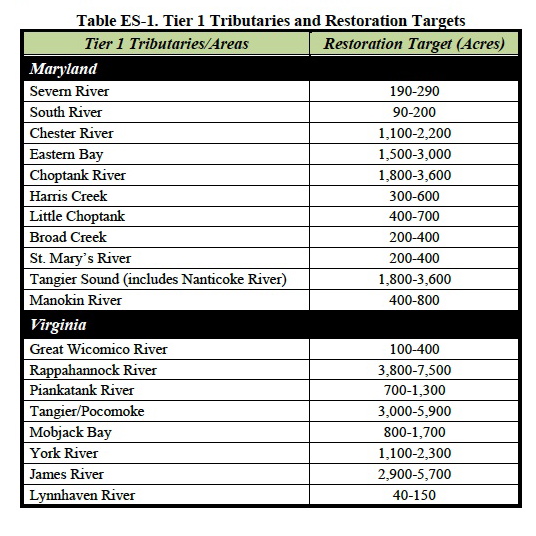
The restoration targets provided in Table ES-1 are estimates of the number of functioning acres of oyster habitat needed within a tributary to affect a system-wide change and ultimately provide for a self-sustaining population. The targets are not meant to be interpreted strictly as the number of new acres to construct. Any existing functioning habitat identified by bottom surveys would count towards achieving the restoration goal, but would not be counted toward new restoration benefits. Similarly, there may be acreage identified that only requires some rehabilitation or enhancement. Work done on that acreage would also count toward achieving the restoration target. The accounting of the presence and condition of existing habitat is recommended as an initial step when developing specific tributary plans. Once that information is obtained, restoration actions will be tailored to the habitat conditions and projected restoration costs (Table ES-2) revised.

The master plan includes planning level restoration costs that incorporate construction of high relief (12 inches) hard reef habitat (using shell and/or alternate substrates), seeding with spat (baby oysters), and adaptive management actions. Estimates are provided for the full construction of the low and high restoration targets. The summary of these costs for all Tier 1 tributaries is provided in Table ES-2. Estimates are conservatively high in that the assumption was made to develop the cost estimates that each acre would require construction of new hard habitat; however, it is anticipated that restoration will not require new habitat construction for every targeted acre. Although Table ES-2 concisely shows the costs for restoring all Tier 1 tributaries, one should not assume that all tributaries need to be restored before benefits are achieved. Further, USACE is not recommending an investment of this magnitude at any one time. Restoration should progress tributary by tributary. Benefits are achieved with each reef and each tributary that is restored. The master plan provides a further breakdown of costs by tributary and separate costs for substrate placement and seeding.

The ecosystem services provided by oysters are numerous (Grabowski and Peterson 2007), but largely difficult to quantify at this stage of restoration. These services include:

(1) production of oysters,
(2) water filtration, removal of nitrogen and phosphorus, and concentration of biodeposits (water quality benefits),
(3) provision of habitat for epibenthic fishes (and other vertebrates and invertebrates),
(4) sequestration of carbon ,
(5) augmentation of fishery resources,
(6) stabilization of benthic or intertidal habitat (e.g. marsh), and
(7) increase in landscape diversity.

Given the vast resources required to complete restoration in all Tier 1 tributaries and the fact that large-scale restoration techniques are in the early stages of development, USACE recommends choosing a tributary or two in each state for initial large-scale restoration efforts following completion of the master plan. This would facilitate the concentration of resources to enact a system-wide change on oyster populations in the tributary and achieve restoration goals, as well as provide for monitoring and refinement of restoration techniques. Monitoring will be guided by the report of the multi-agency Oyster Metrics Workgroup convened by the Sustainable Fisheries Goal Implementation Team of the Chesapeake Bay Program (OMW 2011).

Implementation of large-scale oyster restoration should begin with the selection of Tier 1 tributary(ies) for restoration by restoration partners. Specific tributary plans should be developed for the chosen tributary(ies) and should include a refinement of the restoration target, originally developed in the master plan. (NOAA has initiated development of a draft Tributary Plan Framework that is attached to the master plan in Appendix D.) Restoration partners should work together to acquire and evaluate mapping of current bottom substrates to initiate plan development and scale refinement. The master plan describes many other implementation factors that need to be considered during tributary plan development. Appropriate National Environmental Policy Act (NEPA) documentation would accompany each tributary plan. Once a tributary plan is complete, construction would proceed in a selected tributary by restoring a portion of the target (e.g., 25, 50, or 100 acres) per year given available resources until goals and objectives are met.

The master plan is proposing a sanctuary approach to fulfill USACE’s ecosystem restoration mission and the E.O. goals. In developing the master plan, USACE views oysters as “an ecosystem engineer that should be managed as a provider of a multitude of goods and services” (Grabowski and Peterson 2007). The recommendation for large-scale restoration in sanctuaries has been developed to concentrate resources, provide for a critical mass of oysters and habitat, and promote the development of disease resistance; this strategy is expected to be a significant improvement over past restoration efforts. Establishment of long-term, permanent sanctuaries is consistent with recommendations of the Chesapeake Research Council (CRC 1999), the Virginia Blue Ribbon Oyster Panel (Virginia Blue Ribbon Oyster Panel 2007), and the Maryland Oyster Advisory Commission (OAC 2008). Sanctuaries are necessary to enable the long-term growth of oysters, develop the associated benefits that increase with size, and develop disease resistance. Carnegie and Burreson (2011) also have proposed that sanctuaries may be a mechanism by which to slow shell loss rates.

Although limited, current information suggests that greater economic and ecological benefits are achieved through the use of sanctuaries (Grabowski and Peterson 2007; Santopietro 2008; USACE 2003, 2005). USACE is undertaking additional investigations into the costs and benefits of sanctuaries and harvest reserves. Future tributary plan development which will include applicable NEPA analyses and documentation will incorporate the findings of these investigations. Inclusion of management approaches other than sanctuaries will be considered in specific tributary plans, if justified. On the basis of current science and policy, USACE does support the efforts of others in establishing harvest reserves within proximity of sanctuaries to provide near-term support to the seafood industry and establish a diverse network of oyster resources.

There are a number of issues that may jeopardize the success of any large-scale oyster restoration program. Illegal harvests pose a major risk. Illegal harvests are suspected to have impacted nearly all past Maryland restoration projects as well as the Great Wicomico restoration efforts. Recent estimates are that 33 percent of oysters placed in Maryland sanctuaries between 2008 and 2010 have been removed by illegal harvests; a potentially greater percentage have been illegally harvested since the beginning of restoration efforts in 1994 (Davis 2011). Significant investments are lost and project benefits compromised when reef habitat is impacted by illegal harvests. The expansion of designated sanctuaries in Maryland and enforcement efforts by both Maryland and Virginia should help with reducing illegal harvests.

A second critical factor is the availability of hard substrate for reef construction. Oyster reef is the principal hard habitat in the Bay and significant amounts of reef habitat will need to be restored to meet restoration goals. However, a sufficient supply of oyster shell is currently not available for oyster restoration. Alternate substrates will need to be a part of large-scale habitat restoration. Alternate substrates such as concrete and stone are significantly more expensive and may not be publicly acceptable on such a large-scale; however, these materials greatly eliminate the risk of poaching because the materials can damage traditional harvest equipment. A third issue impacting the success of large-scale oyster restoration is water quality. A restored oyster population has the potential to return filtering functionality to shallow water habitat in the Bay. However, poor land management and further degradation of water quality will jeopardize any gains. Ultimately, water quality benefits provided by oyster restoration will rely on sustainable land management and development. Efforts being undertaken to support the Chesapeake Bay Restoration and Protection Executive Order and the nutrient reduction goals established in the Chesapeake Bay Total Maximum Daily Loads (TMDL) will help address water quality issues. The Executive Order goals targeting water quality, habitat, and fish and wildlife are directly related to achieving the goals presented in the master plan. Opportunities to match oyster restoration efforts, spatially and temporally, with land management projects should be implemented to the greatest extent.

Although USACE and its partners have developed this master plan to guide USACE’s long-term oyster restoration activities, large-scale oyster restoration in the Chesapeake Bay will only succeed with the cooperation of all agencies and organizations involved. VMRC and USACE-Norfolk are working together towards some common ground activities including oyster benefits modeling, a fossil shell survey, monitoring, and rehabilitation of existing sanctuary reefs; and these efforts should continue in the future. Resources and skills must be leveraged to achieve the most from restoration dollars. The greatest achievements will be made by joining the capabilities of each agency in a collaborative manner to pursue restoration activities.

Link to the full report:

Click to access CB_OysterMasterPlan_March2012_LOW-RES.pdf

Good Turnout for TMDL Meeting – But We Missed the Part About The Army Corps of Engineers And Oyster Sanctuaries

About 50 people came to the TMDL meeting in Hartfield, including Mathews County Supervisor Janine Burns and Planning Director John Shaw. About the biggest piece of new information was the BST test– bacterial source tracking — is no longer being used to identify the most likely source of fecal coliform contamination. That takes care of concerns over accuracy of the tests, but we don’t know yet how, or if, specific sources can be determined at this point.

As most of those attending expected, septic systems, agricultural practices, livestock and pets were cited as the areas the implementation plan will target. Wildlife, including Canada geese, were initially dismissed as a significant factor, but the residential/recreational workgroup did get a recommendation on record to involve DGIF or other agencies in exploring this aspect of the problem. It’s still unclear why agencies involved with wildlife are not participating in TMDL meetings from the beginning, if only to provide fact sheets and a point of future contact.

The Department of Environmental Quality (DEQ, along with the Departments of Conservation and Recreation (DCR) and Mines, Minerals and Energy (DMME), issued a TMDL Six Year Progress Report for 2000 – 2006, in March, 2007. In discussing the challenges faced in the Metro Richmond area, the report cited: “Wildlife (such as geese, ducks, beaver, & deer) likely contributes to the impairment.  Methodologies to address these sources may need to be explored and evaluated.” (If there are more recent reports about the results of such evaluations, they’ll be reported here as soon as they’re identified.)

Questions about possible discharges from boats caused heated exchanges, as did the question of the necessity to attempt to bring impaired waters up to the strict standards necessary for shellfish cultivation. For Virginia to continue interstate sales of shellfish, there is no option other than for the state to continue to monitor and report on all shellfish shoreline areas and to develop plans to attempt to clear up impaired waters.

The lack of a sound system and projected graphs and charts that were only visible from the front rows added to the charged atmosphere at times, but overall, the meeting was civil, and DEQ and DCR representatives and residents in attendance were able to express their points of view. There were questions left unanswered due to the time restraints, but by the next meeting, answers should be available on all of them.

This process leading to the creation of TMDL Implementation Plans is not going to be quick or easy. Some of the possible BMPs (Best Management Practices) presented at the meeting may be helpful. We’ll know better after these are reviewed and considered in depth.  I do believe the people involved on all sides are sincere and care about the results, and that the IPs will not just be cookie-cutter versions of other IPs. There is a lot of work to be done locally to achieve that result.

But just when I thought we had a sense of how this whole TMDL process works, we learned from a Southside Sentinel article that the Army Corps of Engineers has plans in progress for the Piankatank and other rivers in the Chesapeake Bay watershed in Maryland and Virginia involving oyster sanctuaries, a fairly significant detail not mentioned in the TMDL meeting, and not at all obvious on either the DEQ or DCR websites. I’ve looked at a lot of TMDL related documents the past few weeks, and the Army Corps of Engineers and oyster sanctuaries didn’t pop out anywhere. A quick look at the Norfolk District Army Corps of Engineers website found this image-link:

http://www.nao.usace.army.mil/News/20120329_PublicMeetingsOysterRestoration.asp
to a public meeting notice about “native oyster restoration plans for VA, MD” and that notice said in part, “The long-term goal is to restore an abundant, self-sustaining oyster population that performs important ecological functions such as providing reef community habitat, nutrient cycling, spatial connectivity, and water filtration, among others, and contributes to an oyster fishery.”
Sounds great, except for what I read in the Sentinel article and in a quick look at “The Master Plan.” Guess I have some homework to do this weekend.

Are Year-round Geese Part of the Water Contamination Problem?

Sunset facing mouth of Queen’s Creek courtesy of Davie Cottrell©

Each impaired shellfish area has unique challenges, so this post is only about Queens Creek, which is listed in the 2007 Gwynn’s Island-Milford Haven watershed TMDL report. It states “septic systems should be a primary implementation focus because of health implications….” Like many official statements, it sounds good at first hearing, but if septic systems are failing near Queens Creek, why would the human contamination drop to 0% on any month’s reading, much less for 3 of 6 readings taken between October, 2005 to August, 2006? But Figure 4.6 B shows 74% for the average annual fecal coliform contributions from wildlife.

Residents on Queens Creek have seen the geese population go from staying half the year to settling in year-round. Does that have anything to do with the high wildlife contributions? Can’t tell from the reports because the details aren’t provided, only totals and percentages for ‘wildlife’.

Mouth of Queen’s Creek courtesy of Davie Cottrell©

Other questions are, “Do the geese increase the phosphorus load too? Are they causing any additional shoreline erosion by eating young shoots?”

 And we need to consider whether there are other conditions that  are making the situation worse? Where are the computer models for evaluating the impact of the lack of dredging? The waters in Queens Creek used to be navigable, but they’re not for many craft today. If the Creek is dredged, would more water flow in and out with each tide change the capacity to process the impact of wildlife contamination? How much has settled in the silt at the bottom of the shallower creek to be stirred up by storms? (And on a separate point, if dredged material is spread in the sun, can the natural UV  disinfect it so it would then be usable to nourish the marshes that are being eroded by wave action and storms?)

But as things stand, continual contamination means the waters have no possibility of recovery naturally, so what happens to the areas further downstream?

The report acknowledges that for some areas, “water quality modeling indicates after removal of all of the sources of bacteria (other than wildlife), the stream will not attain standards under all flow regimes at all times. However, neither the Commonwealth of Virginia, nor EPA is proposing the elimination of wildlife to allow for the attainment of water quality standards….The reduction of wildlife or changing a natural background condition is not the intended goal of a TMDL.”

What is their plan? Even if all the effluent, pet and livestock elements are reduced as far as humanly possible, according to the 2007 report, the bottom line is the state agencies don’t plan to do anything–except change the assigned use of the waters–probably permanently.

It’s relatively easy for TMDL plans to go after the obvious 8% human element, 9% livestock and 9% pet contamination the state tests indicate. It’s not going to be easy to deal with the rising population of geese, but information is available about how to address the problem. Now we have to see if our state agencies are going to go beyond the obvious and deal with the 74% of bacterial contamination attributable to wildlife. Wonder if we’ll find out on the 23rd.

TMDLs? Mathews Residents Need To Figure Out How to Play This Numbers Game on May 23, 2012

I don’t think you can find anyone who will say they want dirty, fecal-contaminated water in their rivers, creeks and bays. But there are no easy answers for how to clean them up, or even how to guess how many potential sources there are. Yes, I said guess, because most of the reporting comes from computer modeling based on computer generated land use maps. Short of going out and counting every dog, raccoon, deer and duck, the best we can do is an educated guess.

<<JUST IN: IMPLEMENTATION PLAN SIMILAR TO WHAT WE CAN EXPECT:Greenvale Creek Implementation Plan>>

But we can apply common sense and general knowledge to refine those computer models. We’re on a deadline here: a public meeting has been called for May 23rd at the YMCA in Hartfield, 6:30 – 8:30 pm, for Mathews, Middlesex and Gloucester residents.   DCR Meeting Notice 5-23   It’s up to us to show up and share what we know. We need to question what doesn’t make sense in the old reports too — before the same information is passed along to the plans that will follow this meeting.

Shellfish Factsheet What we know right now is the Department of Environmental Quality defines TMDLs (Total Maximum Daily Load) as “the total pollutant a water body can assimilate and still meet standards.” And there are 9 creeks feeding into the Gwynn’s Island/Milford Haven Watershed or Piankatank River and parts of the Piankatank that are impaired and have levels of fecal coliform bacteria that are too high for growing shellfish.

If more information turns up, I’ll add to this post. Links to the old reports follow, with maps that show the areas involved.  See you at the meeting on the 23rd!

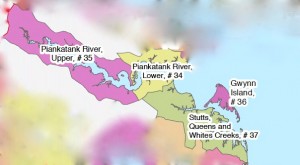
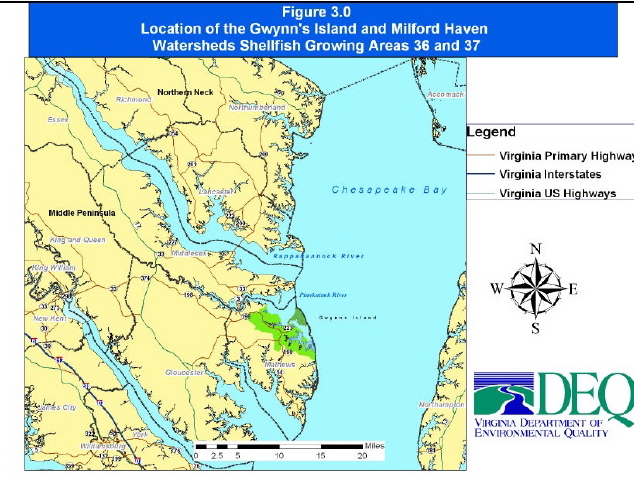
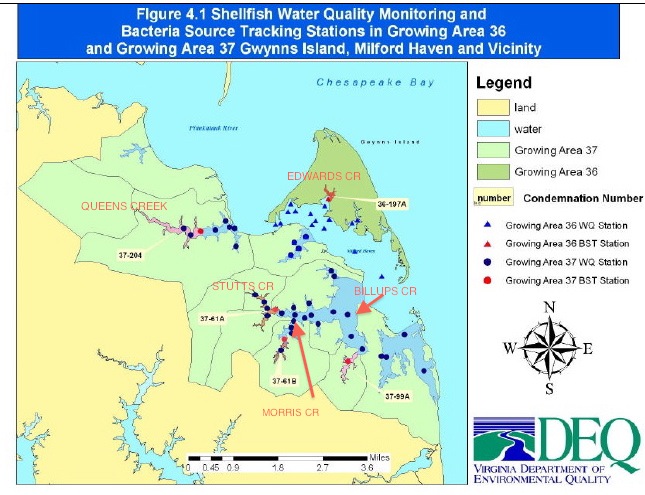
The impaired waters being discussed are located in these VA Dept of Health Shellfish Growing Areas

TMDL Report Gwynn’s Island and Milford Haven Watersheds

Gwynn’s Island and Milford Haven Watersheds shown in green

TMDL Lower Piankatank River

TMDL Modified Report Lower Piankatank River

TMDL Report Upper Piankatank River

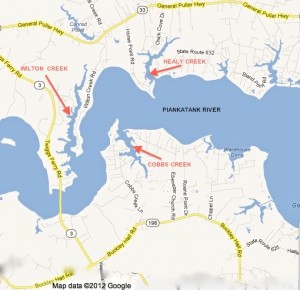
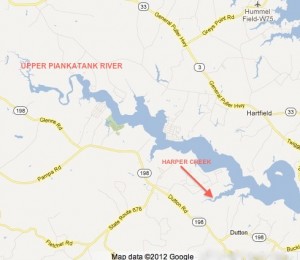
5 Creeks in Gwynn’s Island-Milford Haven Watershed With Impaired Shellfish Waters


Wilton, Healy and Cobbs Creeks

Upper Piankatank River and Harper Creek


New Point Comfort Development Company’s Plans: A Mathews Resort – But Only On Paper

The last post showed this Wetlands Watch slide used in a Middle Peninsula Planning District Commission presentation.

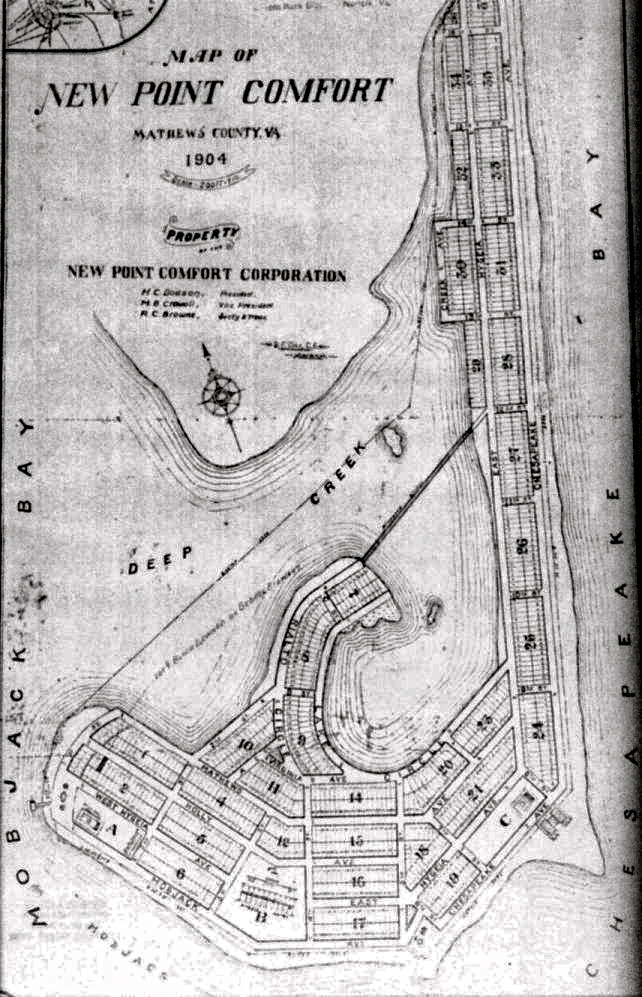
It’s true you’ll find water and some marshes today where the lots were shown on a 1904 Mathews County subdivision map near the lighthouse. But what the MPPDC/Wetlands Watch slide doesn’t say is the development company planned to fill in the tidal marshes and bring in sand to create beaches. The New Point Comfort Lighthouse site online says that the enormous cost to carry out that plan is what caused the company to go out of business the following year.

New Point Comfort Development Company Subdivision Plan – 1904


So what happened to the tidal marshes, sandbars and shoaled areas that existed in 1904 and earlier? And what about the photos and stories of people a generation or two ago who went to sandy beaches at New Point for picnics and outings?

Sand moves with the wind and waves. It is washed away, and bars and beaches reform at another place if there’s enough material available. But major storms can play havoc with that process. The Office of Naval Research describes one kind of current along the coast called the Longshore Current, how it moves, and how it can cause powerful and dangerous rip currents.

There’s an animation of the wave action that can produce sandbars on ONR’s educational Science and Technology Focus website at: http://www.onr.navy.mil/focus/ocean/motion/currents2.htm

With hurricanes and some other storms, the low pressure system increases the speed of longshore currents and height of waves. When these stronger longshore currents produce rip currents, they excavate channels through sandbars. The sand then accumulates in a quieter areas forming new bars. In this way, depending on the number and types of storms, and the intervals between storms, sandbars appear to migrate. When sand is exposed and dry, the wind then moves it to build up beaches–or blow them away. Beaches can only build up when dry sand is available. If the angle of a beach changes, so that the sand remains wet, the beach will not grow and can be diminished by wave action or the effects of storms.

The Chesapeake – Potomac Hurricane of August 23rd, 1933 and the one that hit on September 16th, 1933  ripped through the area around New Point Comfort, leaving two separate islands we see today. But the New Point Comfort Lighthouse withstood the tremendous winds and rain and waves, and isn’t that the story that really matters?