Beavers Love BMPs
(Big Messy Projects)

By G. C. Morrow

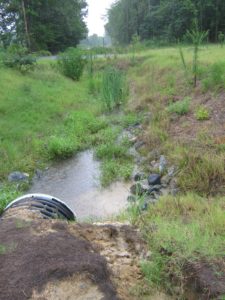
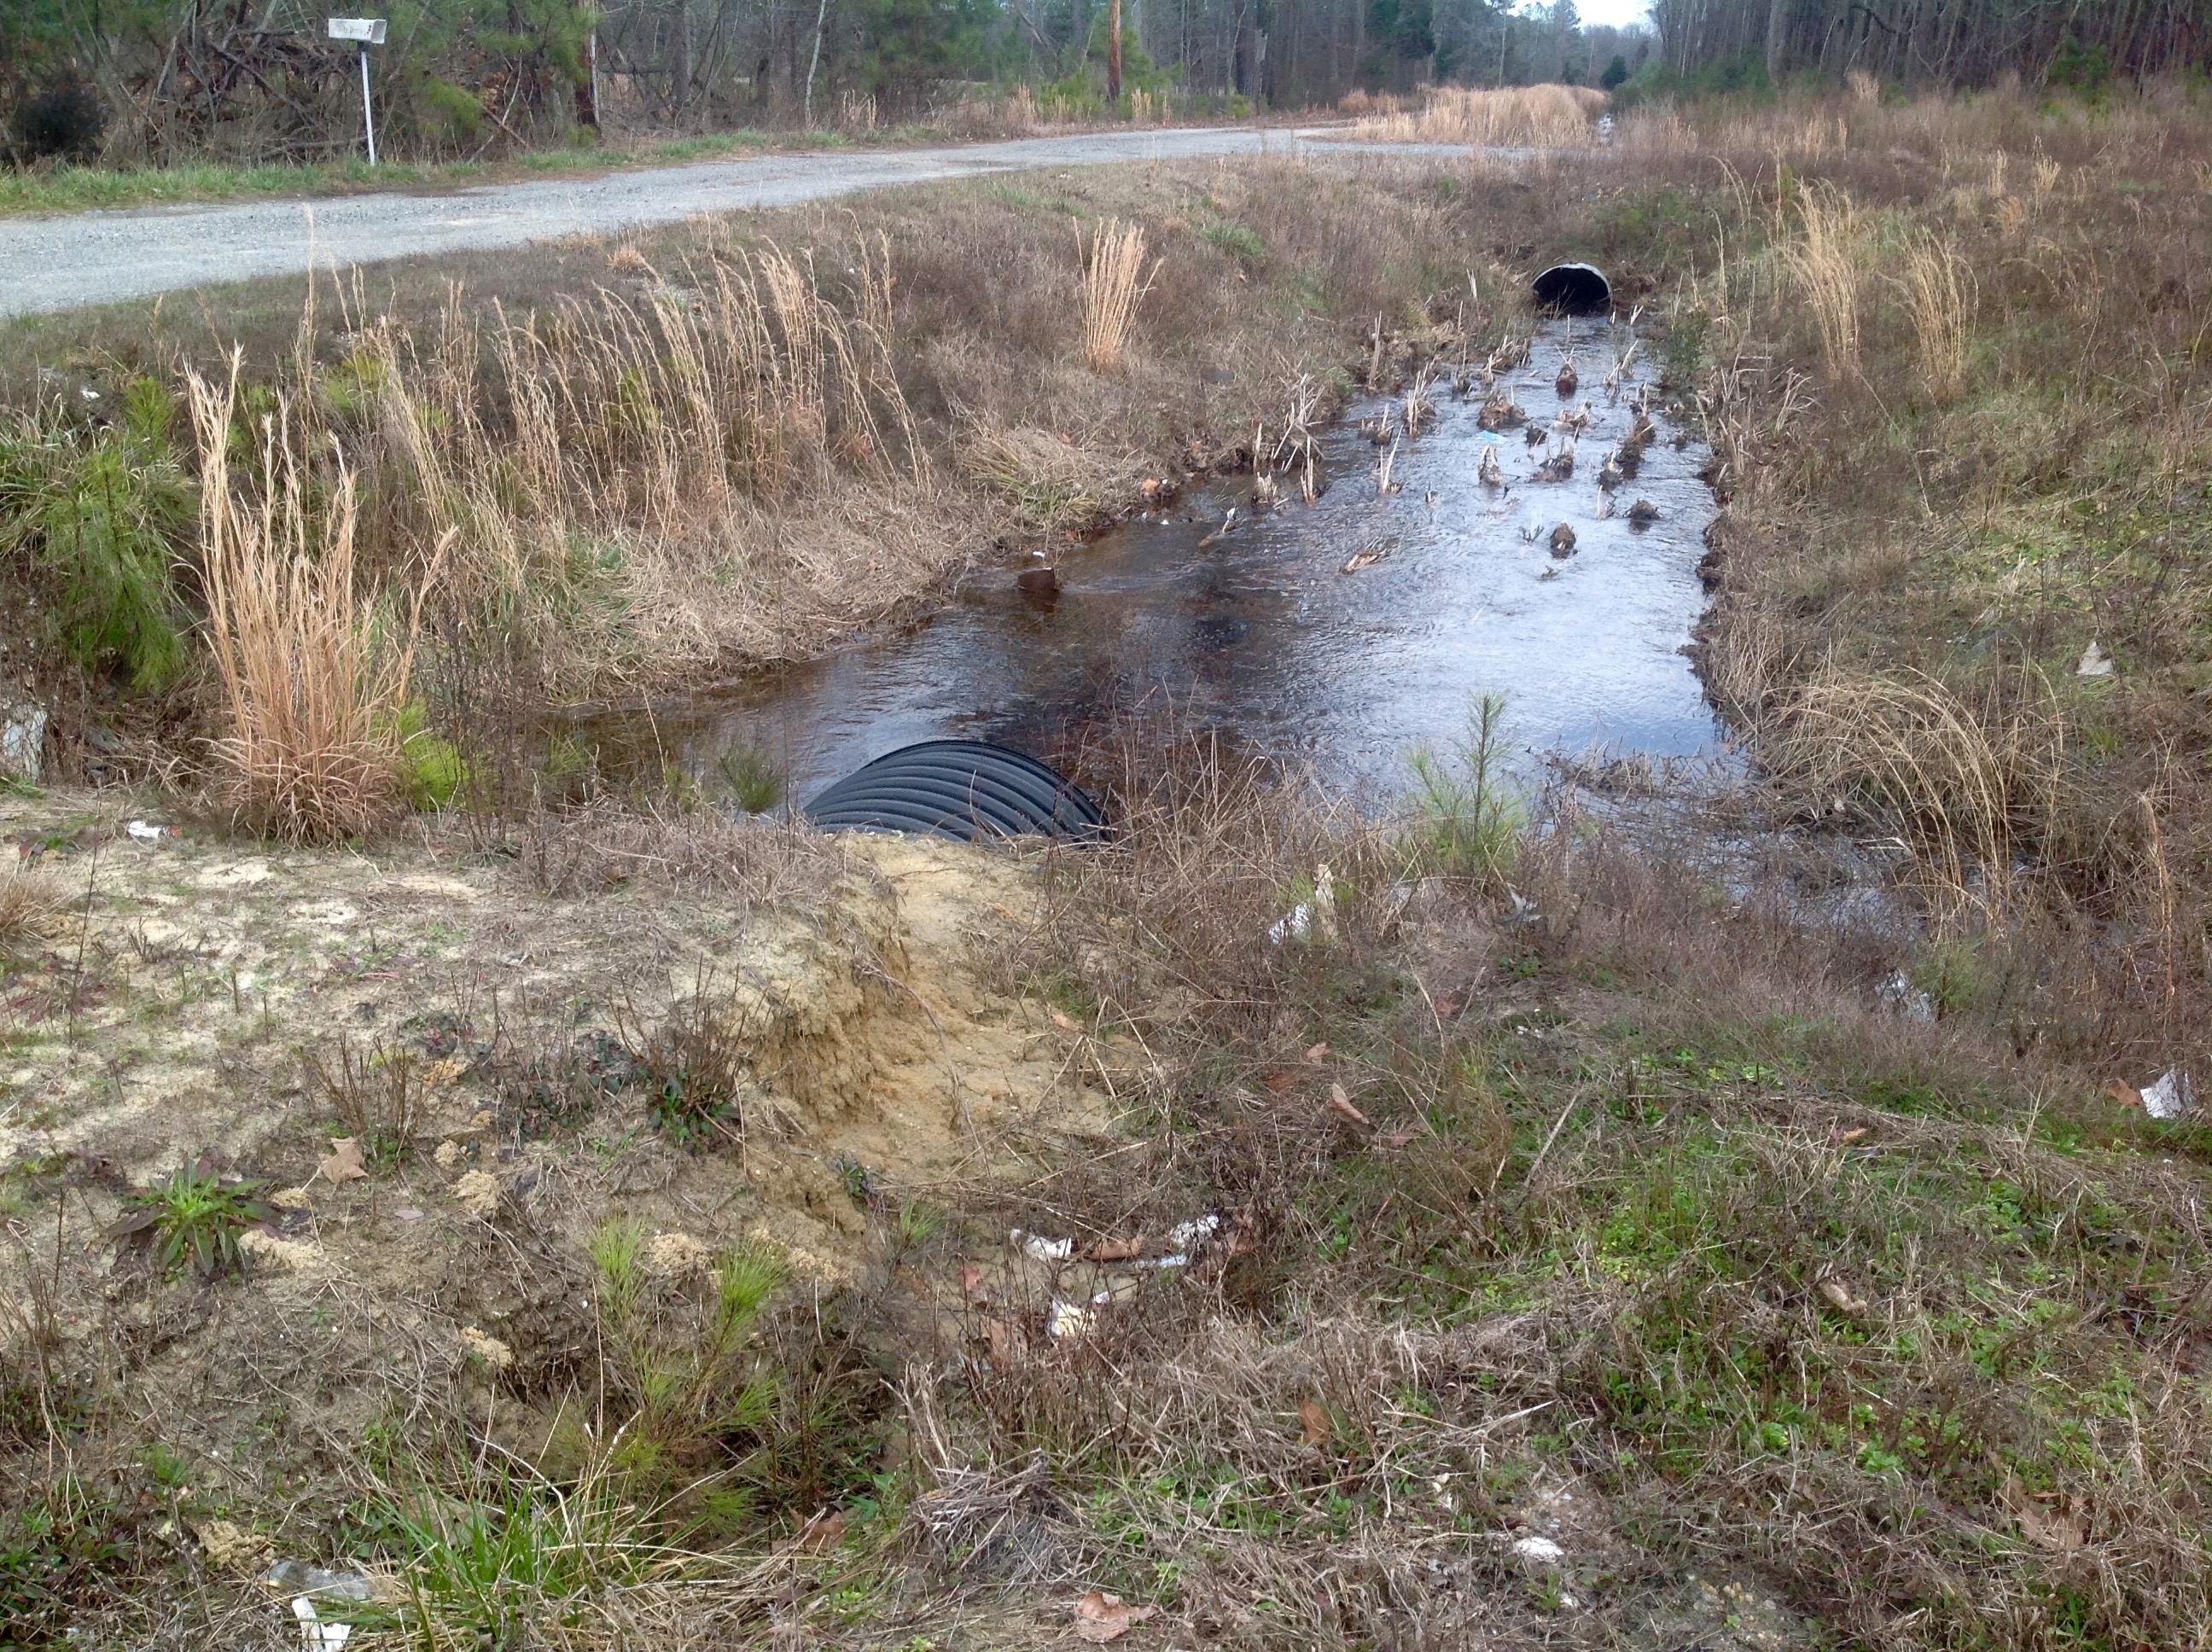
Wards Corner Outfall Beaver Dam

Wards Corner Outfall Beaver Dam

I decided to look at previous projects to see if I could find a pattern in their failures. It is extremely hard to conceive that these projects with their half million plus engineering budgets fail so miserably at their purpose. At first glance, it appears that the engineers are attempting to move their drainage conveyances to more accessible locations, but even the greenest of engineers should know better than to try to drain water uphill.  (G. C. Morrow, June 15, 2016)http://insidethecrater.com/714-2

Most of the environmental and pollution problems we are facing in stormwater management can be traced to very simple explanations and solutions. I warned in 2016, “South of Wards Corner, there are three outfalls much lower in elevation than the one at Wards Corner, and they are necessary to handle several hundred acres of stream flow, as well as roadside drainage.”

Beavers are drawn to the sound of water whose flow is disrupted. They have invaded the Wards Corner outfall, as well as two unmaintained neighboring outfalls.

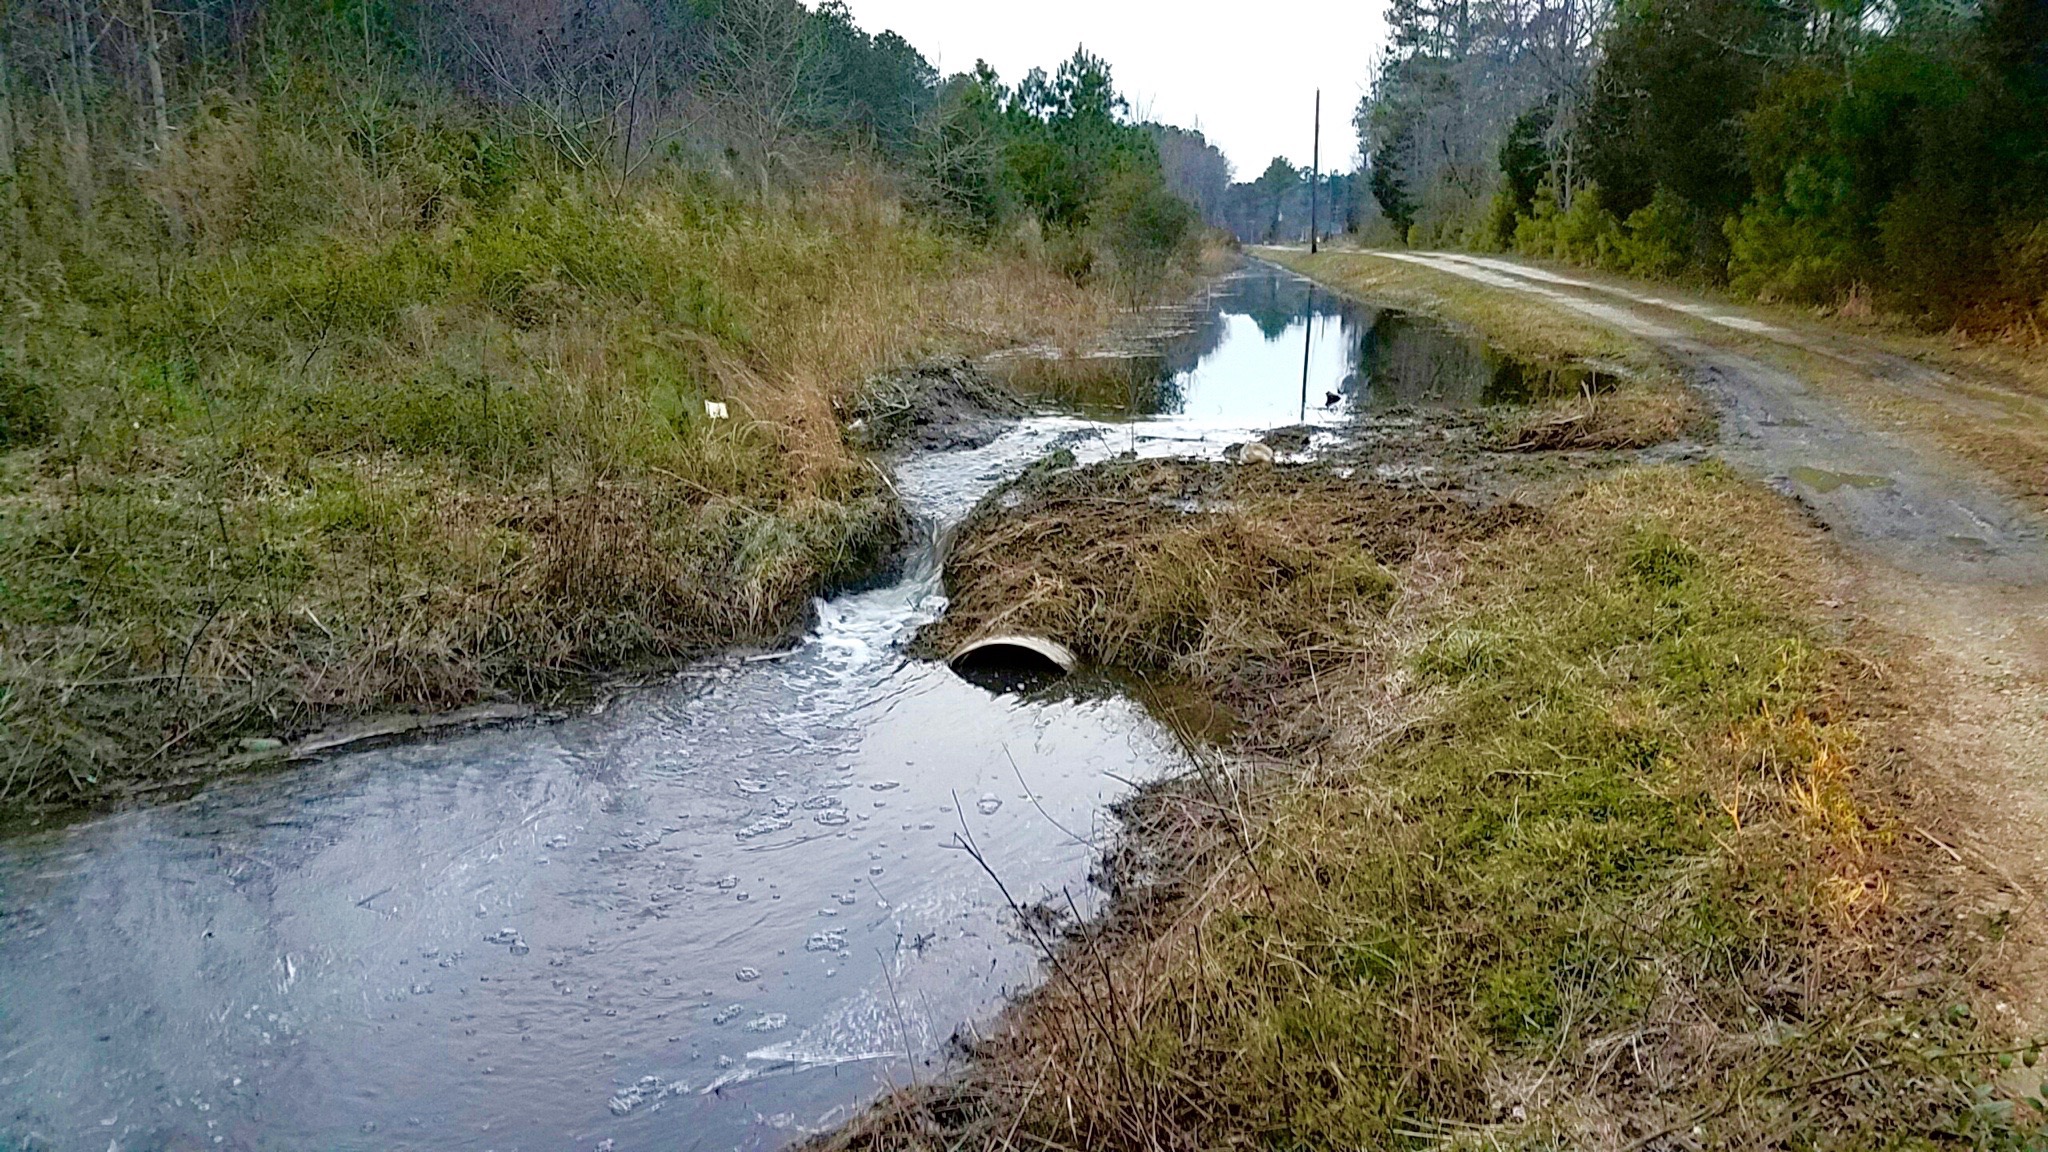
I saw three dams at Wards Corner this week. At one place, the dam filled the outfall to the top, about 6-8 feet deep. Water was overflowing next to a 36-inch pipe and cut through the earth surrounding the pipe to create a spillway. This eroded soil is going downstream into the marsh.

Similar erosion has occurred around the 36-inch pipe at the start of the outfall off the shoulder of route 198. Old-fashioned concrete endwalls would have prevented the erosion at both locations, but today, only cosmetic plastic endwalls are used–and this project didn’t even use those.

We won’t know until the dams are cleared exactly how the beavers managed to block the flow so well. If the outfall had functioned properly, draining within 2-3 days after rainfall, there shouldn’t have been enough water to attract beavers in the first place, especially since the outfall is uphill of most of the area it’s supposed to drain.

A large number of saplings, stripped of their bark, are lined up on the banks near the dam, ready to be used to enlarge or repair it. The beavers will continue to stop the water as long as it’s moving slowly enough for them to harness it to float the saplings into place.

It appears that using rock checkdams to slow down the water flow in a rural environment is not the right answer. Putting the drainage in the right place might have been a better idea.

Makes you wonder why the state spent $1.6 million to cause perpetual flooding of downstream locations. A much smaller amount could have restored the outfall to Stutts Creek behind the high school, and cleared or even replaced the pipes in the VDOT easement along the football field. Doing that would have conveyed the water from Route 198 to the creek and not let it flood the school and park properties. Now, the county is being asked to fund half the cost of the restoration through revenue sharing or continue to suffer the damage of its property. It may be that VDOT’s failure to maintain an outfall inventory meant the designers didn’t know about the existing outfalls.

At some point, VDOT designers and engineers have to use real world considerations and get away from their laptop configurations. Overbuilding to create a new construction project, instead of developing a simpler restoration of existing structures, is not a better value-based decision in the long run, even if federal money is involved. And that era may be ending soon.


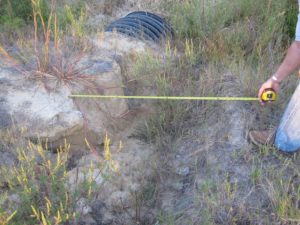
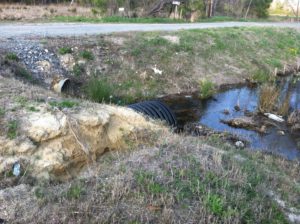
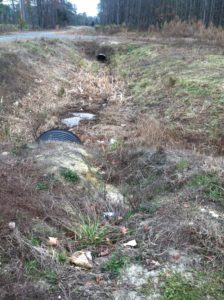
The following pictures are taken at the shoulder on Route 198 looking toward the area with the beaver dam showing the progressive erosion.

Wards Corner 2012

Wards Corner 2012

2013--eroded area 4-feet wide

2013–eroded area 4-feet wide

2014

2014

2015

2015

2016

2016

Excerpts and Errors from the Middle Peninsula All Hazards Mitigation Plan — Another Installment of Accuracy Not Guaranteed

                                                                  By Carol J. Bova

There are so many major and minor mistakes about Mathews County in the regional All Hazards Mitigation Plan, there’s no easy way to address them at one time. Maybe it’s time to start an ongoing catalog of them to get a head start on the 2021 Mitigation Plan. We learned with previous reports like the Regional Water Supply Plan that there’s a very slim window for public input, and once a report is written, MPPDC has no interest in changing it. Even when citizens presented information at a meeting of the MPPDC about the Roadside and Outfall Ditch Report and asked that the report not be accepted until corrected, they acknowledged the errors and accepted it anyway, saying they’d correct it afterwards. The result: MPPDC staff decided there were no errors, and the mistakes in it continue to be recycled in newer reports, like the recent Virginia Coastal Policy Center’s Ditch Maintenance Study. That one involved a $40,000 grant, examined one ditch, and came up with the wrong answers, largely due to the influence of the earlier MPPDC reports. (More on that in a future post.)

With that background in mind, let’s look at the Hazards Mitigation Plan. The Plan is 556 pages, divided into 5 parts. They are available at mppdc.org.

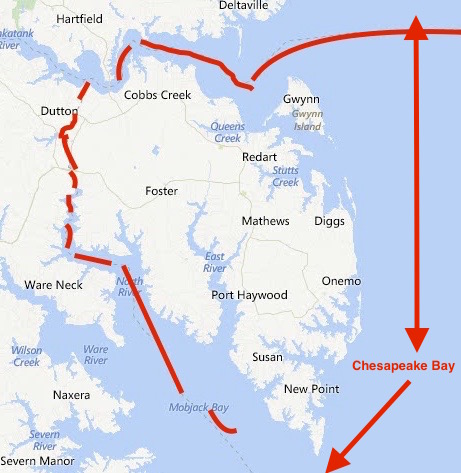
Mathews County is located at the eastern tip of the Middle Peninsula. The County is bordered mostly by water, with the Chesapeake Bay to the east, the Mobjack Bay to the south, the North River to the west, and the Piankatank River to the north. Except for approximately five miles that border Gloucester County, the County’s perimeter is formed by its 217 mile shoreline. (Part1, pg. 16.)

The name and location are correct, and a peninsula is largely bordered by water. A few minor details are off, like the Chesapeake Bay is to the east and south of Mathews, and the western border includes Mobjack Bay along with the North River and the Gloucester County line. The miles of shoreline number is off by 130 miles. The Virginia Institute of Marine Science reported 347.42 miles of shoreline on page 20 of the 2008 Mathews County Shoreline Inventory. Eight years should have been long enough for the MPPDC to become aware of the fact.

Image Courtesy of FEMA Region III (red notes added)

Image Courtesy of FEMA Region III (red notes showing Mathews’ area added)

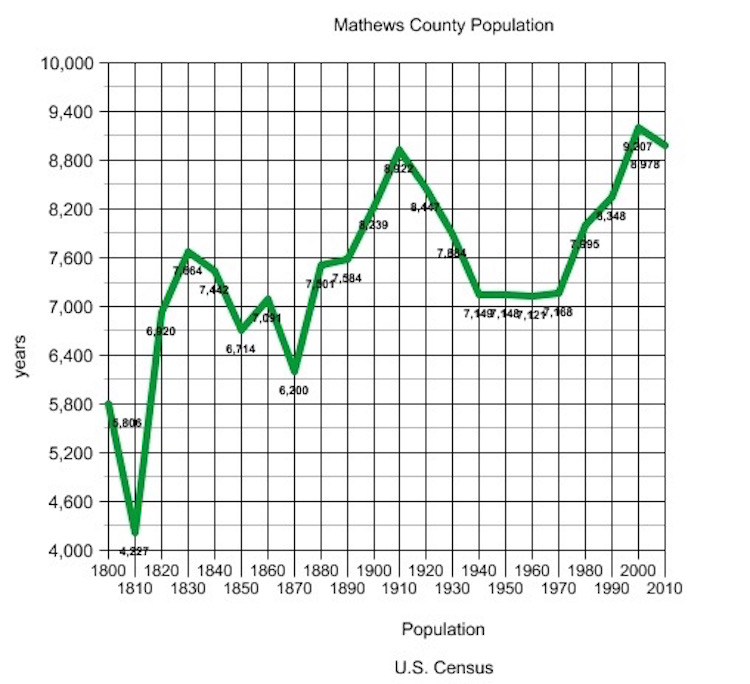
The plan’s presentation of the county’s population over the years is at odds with reality.

Mathews County’s population changed little between 1840 and 1900. The population peaked in 1910 with 8,922 residents, but gradually declined over the next five decades to a low point of 7,121 in 1960. This was in keeping with a national trend of population shifts from rural to urban areas because of the increased job opportunities in the cities. The population began to grow in the 1970’s and it took until the mid 1990’s before the population reached the peak reported in 1910.

An actual graph paints a different story. After every decline in population, there’s been an upward trend. Mathews will never be an urban area, nor would most of its residents want it to be. What’s MPPDC’s purpose in distorting the description of the population pattern?

Mathews Population from U.S. Censusu 1800-2010

MPPDC’s lapses in accuracy continue on page 75 of the All Hazards Plan under Ditch Flooding Vulnerability.

Throughout the Middle Peninsula of Virginia, the network of aging roadside ditches and outfalls, serving 670 miles of roads, creates the region’s primary stormwater conveyance system.

Arithmetic is a weak point for the Middle Peninsula Planning District Commission. According to VDOT statistics, the six counties involved in this regional plan have 279 miles of primary roads and 1,358 miles of secondary roads between them. Even if I didn’t have an educated pencil, my computer says that’s 1637 miles. My Echo Alexa agrees.

Currently each locality in the region experiences inadequate drainage and as a result, roads and private properties are frequently flooded after a storm event. The lowest lying localities (ie. Mathews and Gloucester County) are more vulnerable to ditch flooding as most of their land is either at or slightly above sea level.

Mathews is part of two watersheds and seven subwatersheds all existing so rainfall not absorbed by the land can reach the rivers and Chesapeake Bay. An extensive complex of streams follows the topography which consists of gentle contours from about 3 feet in the southern salt marshes to 35 feet in the northwestern region.

“At or slightly above sea level”? No wonder MPPDC thinks a foot and a half of sea level rise will wipe out a third of Mathews.

Watch for the next installment of Accuracy Not Guaranteed when the error catalog of the Middle Peninsula All Hazards Mitigation Plan continues.

Consider the Source: University of Virginia Institute for Environmental Negotiation Strategy List

The Mathews County Planning Commission is considering a list of “tools” MPPDC provided as ideas for a county whose goal is “living with the water.” The  MPPDC (Middle Peninsula Planning District) suggestions for Mathews County’s comprehensive plan revision focus more on how not to develop the county’s land resources than any future use planning. There is a heavy emphasis on urban stormwater management which doesn’t fit our rural and relatively undeveloped county.

Our rural stormwater needs are centered on getting the Virginia Department of Transportation to fix its failing state road drainage systems that are flooding private property and woodlands. To their credit,  VDOT seems to be hearing that message and is reaching out to partner with the county in working on the long-neglected problem. But there isn’t one word about VDOT’s drainage issues or the state’s responsibility in the “toolbox.”

The MPPDC tools do include the possibility of creating special hazard districts and Imposing new taxes and stormwater fees, and of course, the pet project of Executive Director Lewie Lawrence, the creation of a Ditching Authority. This would be a regional authority that would decide how much to tax landowners for the maintenance and repair of roadside and outfall ditches that cross their land across the Middle Peninsula. This Authority would act without the counties’ involvement or control if enabling legislation is created to permit its formation.

The basic idea ignores the fact that most of the roadside ditches are within the VDOT right-of-way, and where they’re not, there are easements for them, even though some of these were covered by consent of landowners, some dating back to the late 1800s. Others are included in right-of-way deeds as granting any land necessary “to construct, improve and maintain any drain ditches or other drainage facilities that may be needed for the proper and adequate drainage of said Route.” Also ignored is the fact is the number of outfalls that are natural streams that VDOT excavated. They are still considered streams by the Commonwealth, and landowners are not responsibile for their maintenance.

The MPPDC tools offer at least 11 ways to trade away Mathews land for cash payments or tax credits now that will prevent development here in Mathews forever. Some will allow urban developers to ignore an urban area’s zoning or environmental regulations and mitigate their violations by trading their building or ongoing pollution for unspoiled Mathews land. Transfer of development rights allows the urban over-development and eliminates ours. Polluters can keep polluting and substitute credits for locking in our land from development and paying us for the privilege. This doesn’t do anything to help the Bay. We’re already doing our part to help it recover, but the urban developers can continue to impair and damage it.

Conservation easements can be a good thing, but how do they fit into the County’s future? No one is looking at the long term effects of the MPPDC efforts to gather up these easements, which it can then transfer to other nonprofits. Are they going to become income sources for allowing pollution and overdevelopment elsewhere? That’s not explained in the toolbox list. So where did some of these ideas originate? Following is the 7-page strategy list included in a 2013 report to the legislature. Some of the strategies are sound, but others are being used now as part of the MPPDC toolbox against the best interests of Mathews for the long run.

Carol J. Bova

================================================================

RECURRENT FLOODING STUDY  FOR TIDEWATER  VIRGINIA
This report identifies recurrent flooding issues throughout Tidewater
Virginia, examines predictions for future flooding issues and evaluates a
global set of adaptation strategies for reducing the impact of flood events.

Report submitted to the Virginia General Assembly
January 2013

credit for recurrent flooding

Pages 128-134.  Full document at:

http://ccrm.vims.edu/recurrent_flooding/Recurrent_Flooding_Study_web.pdf


Section 4.6 IEN strategy list

The following lists are presented courtesy of the University of Virginia Institute for Environmental Negotiation.


Local Government Tools for Addressing Sea Level Rise in Virginia

DRAFT

Planning Tools To Be Considered for Discussion at Focus Groups

Compiled by the University of Virginia Institute for Environmental Negotiation

Sources cited below

January 2012

LAND USE: Examples of tools relating to land use concerns

  1. Update the local Comprehensive Plan to:
    1. Establish the rate of estimated sea level rise and time period over which it may occur.
    2. Designate areas vulnerable to sea level rise.
    3. Site future public infrastructure and capital improvements out of harm’s way.
    4. Provide the scientific basis to justify changes in land use decision-making, including an analysis of likely sea level rise hazards (inundation, flooding, erosion), and vulnerabilities (to specific areas, populations, structures and infrastructure).
    5. Plan responses to sea level rise.1
  1. Using data gathered on potential sea level rise and predicted flooding, update existing or designate new inundation zones or flood plain areas.2
  1. Integrate vulnerability assessments and sea level rise considerations into the locality’s existing Wetlands Ordinance.3
  1. Revise local zoning and permitting ordinances to require that projected sea level rise impacts be addressed to minimize threats to life, property, and public infrastructure and ensure consistency with state and local climate change adaptation plans.4
  1. Use overlay zoning to protect shorelines and other vulnerable areas. Overlay districts could prohibit shoreline protection structures, implement shoreline setbacks, restrict 1 future development, lower non-conforming use thresholds, or raise “free board” building code requirements. Shoreline overlay districts could take the form of either:
    1. A fixed-distance zone along the shoreline that would extend across all existing shoreline zoning districts; or
    2. A variable, resource-based zone, based on a scientific inventory of existing shoreline resources. The zone would vary in distance from the water line according to the identified resources.5
  1. Designate specific thresholds of land disturbance in square footage or acres that trigger a Water Quality Inventory Assessment.6
  1. Under section 15.2-2286 of the Virginia Code, offer tax credits to landowners who agree to voluntarily “downzone” their property.7
  1. Offer Use Value Assessments for owners who preserve shoreline property as open space or Wetlands Tax Exemptions to owners who agree to preserve wetlands and riparian buffers. These strategies are authorized under Virginia Code sections 58.1-3230 and 58.1-3666, respectively.8
  1. Enter into voluntary agreements with landowners to establish “rolling easements” with boundaries that shift as the mean low sea level rises. These would allow landowners to continue with their current land uses until sea level rise actually occurs. At this time, the concept of “rolling easements” is still relatively new.9
  1. Extend Resource Protection Area and Resource Management Areas under the Chesapeake Bay Preservation Act (CBPA) ordinance. These areas can be extended if specific performance criteria that contribute to the stated goals of the CBPA (pollution reduction, erosion and sediment control, stormwater management) are established.10

NATURAL RESOURCES: Examples of tools relating to concerns

1.Prevent the erosion of storm water canals and shoreline by regularly removing trash, vegetation, sands, and other debris.11

  1. Restore prior-converted wetlands to provide storage and filtration and mitigate storm flows and nutrient loading.12
  1. Require new landscaping to incorporate flood and salt-water tolerant species and focus on creating buffers and living shorelines to reduce erosion.13
  1. Continue implementing beach replenishment and nourishment efforts.14
  1. Where possible, adopt shoreline protection policies that encourage the use of living shorelines rather than shoreline hardening.15 Where this is not feasible, protect land and buildings from erosion and flood damage using dikes, seawalls, bulkheads, and other hard structures.16
  1. Encourage shoreline property owners to implement shoreline management practices, including managing marshland and constructing stone sills, breakwater systems, revetments, and spurs.17
  1. Expand the adoption of accepted soil-conservation agricultural management practices to reduce erosion and polluted runoff.18
  1. Institute engineering strategies to mitigate saltwater intrusion into freshwater aquifers, including the construction of subsurface barriers, tide control gates, and artificially recharging aquifers.19
  1. Establish and maintain corridors of contiguous habitat along natural environmental corridors to provide for the migration and local adaptation of species to new environmental conditions.20
  1. Develop a price-based accounting system for ecosystem services.21
  1. Provide local businesses with information on the importance of maintaining the health of shorelines.22 (good voluntary approach if the case can be made “why do this”
  1. Remain aware of the effects that flood mitigation strategies, such as beach replenishment, have on wildlife.23

SAFETY AND WELFARE: Examples of tools relating to safety and welfare concerns

  1. Develop sea level rise action plans for critical local infrastructure. If existing transportation infrastructure is at risk, “develop plans to minimize risks, move infrastructure from vulnerable areas when necessary and feasible, or otherwise reduce vulnerabilities.”24
  1. Implement an early warning system for flooding that would monitor rainfall and water Levels and notify relevant government agencies and the general public in the event of an emergency.25
  1. Improve the ability of local infrastructure to efficiently handle drainage in the event of increased flooding. This could involve minimizing the construction of new impervious surfaces in flood-prone areas.26
  1. Amend existing zoning ordinances to require increased building elevations and setbacks, flood-proofing, and reduced density for new construction within flood zones.27
  1. Improve and enhance traffic rerouting and emergency evacuation protocols related to flooding events.28 (First responders love this stuff)
  1. Ensure that hospitals, evacuation refuge sites, fire and emergency rescue facilities, and key transportation routes are outside of inundation zones or are secured against projected flooding.29
  1. Redirect new infrastructure development away from low-lying neighborhoods and other at-risk areas, and elevate and armor existing critical infrastructure.30
  1. Require private sector owners of infrastructure to conduct sea level rise vulnerability assessments and develop their own sea level rise adaptation plans as a condition for permit approval.31
  1. Encourage the graduated repurposing of structures that are rendered unsuitable for their current use by sea level rise.32,33
  1. Gradually withdraw public services in flooded areas.34, 35

QUALITY OF LIFE: Examples of tools to address quality of life concerns

  1. Involve businesses in the planning process to prevent the loss of shoreline business and to mitigate the impacts of increased flooding and sea level rise.36 (could be a good voluntary strategy for public awareness.)24
  1. Establish a Transfer of Development Rights program to allow the owners of at-risk shoreline properties to sell development rights to upland landowners.37
  1. Permit the use of Onsite Density Transfers, which allow developers to subdivide lots into smaller and denser parcels if they preserve a portion of the lot as open space and cluster the subdivided parcels.38
  1. Purchase flooded property from landowners.39
  1. Organize coastal businesses and homeowners to appeal to insurance companies for affordable rates and deductibles.40
  1. Organize coastal businesses and homeowners to petition local, state, and federal politicians to address sea level rise.41
  1. Require realtors to disclose the threat of sea level rise and the responsibilities of shoreline owners to potential purchasers of shoreline properties.42
  1. Implement special taxing districts that cover the real, life-cycle costs of providing government services in high-risk flood zones, resulting in higher taxes for property-owners in those zones.43
  2. Use a financial regulatory program to discourage increasingly risky investments along the shoreline. Examples of existing programs with similar aims include:
    1. The state regulation of the property loss insurance sector to reflect higher risk from sea level rise, and
    2. Placing conditions on economic development to require the completion of a long-range vision and plan that addresses sea level rise and flood risk.44
  3. Hold a series of meetings with stakeholder groups to discuss and gauge potential sea level rise impacts to the region or locality.45
  1. Educate local elected officials on sea level rise, and the predicted impacts to the region or locality.46
  1. Present data in easily-understood terms, such as X acres will be flooded, X homes lost, and X impacts to wildlife.
  1. Extend media coverage to issues related to sea level rise to increase public awareness and to help citizens prepare for emergencies. This can include the use of social media, such as Facebook, as well as traditional media, including radio, television, and newspapers.48
  1. Increase public outreach, including press conferences, information sessions, community events, public meetings, and exhibits on sea level rise at libraries, aquariums, and museums.49
  2. Using modern technologies such as GIS mapping software, develop education programs for residents as well as students in local and regional schools.50
  1. Educate residents about the role that fertilizing, vegetation removal, and litter play in increasing flooding, erosion, and property damage.51
  1. Provide landowners with accurate data on the current and future vulnerability of their property to sea level rise as well as best managing practices for mitigating the effects of increased flooding.52
  1. Raise public awareness of areas prone to flooding through increased signage.53

OTHER TOOLS to consider

  1. Craft a “Community Resilience” policy statement emphasizing the need for science-based vulnerability assessments, adaptation planning, education and public engagement, and the development of flexible regulatory and non-regulatory strategies for addressing sea level rise.54
  2. Compile a sea level rise impact assessment. This is often a long-term, multi-phase effort. Steps can include:
    1.  Assembling an advisory workgroup.55
    2. Identifying flood zones and at-risk populations.
    3. Mapping regional and county sea level rise predictions to show impacts to existing development and natural areas; and
    4. Assessing and prioritizing economic and ecological vulnerabilities to sea level rise.

===================================

1 Georgetown Climate Center, Stemming the Tide: How Local Governments Can Manage Rising Flood Risks –
Review Draft 3 11 (May 2010), on file with author.
2 See id. at 9-10.
3 Virginia Polytechnic Institute and State University (“Virginia Tech”), Building Resilience to Change: Developing
Climate Adaptation Strategies for Virginia’s Middle Peninsula – DRAFT 16 (October 2011), on file with author.
4 L. Preston Bryant, Jr., Governor’s Commission on Climate Change, Final Report: A Climate Change Action Plan 35
(Dec. 15, 2008), on file with author.

5 Virginia Tech, supra note 2 at 13, 32, 43.
6 Id. at 16.
7 Georgetown Climate Center, supra note 1 at 18.
8 Virginia Tech, supra note 3 at 43.
9 Id. at 36, 43; see also Georgetown Climate Center, supra note 1 at 19-23.
10 Virginia Tech, supra note 1 at 43.
11 Institute for Environmental Negotiation (“IEN”), Sea Level Rise in Hampton Roads: Findings from the Virginia
Beach Listening Sessions, March 30-31, 2011, Final Report 61, available at
http://www.virginia.edu/ien/docs/Sea_Level_Rise%20final%20report%207-19.pdf.
12 Virginia Tech, supra note 3 at 27.

13 IEN, supra note 11 at 57.
14 Id. at 59, 65.
15 See Bryant, supra note 4 at 36.
16 Virginia Tech, supra note 3 at 35.
17 Id. at 42.
18 Id. at 28.
19 Id. at 13.
20 IEN, supra note 11 at 64.
21 Virginia Tech, supra note 3 at 21.
22 IEN, supra note 11 at 61.
23 Id. at 64.

24 Bryant, supra note 4 at 35; see also IEN, supra note 2 at 64-65.
25 See Virginia Tech, supra note 3 at 22.
26 IEN, supra note 11 at 57, 61.
27 Id. at 43; Georgetown Climate Center, supra note 1 at 11.
28 William A. Stiles, “A ‘Toolkit’ for Sea Level Rise Adaptation in Virginia” 4.1.3, on file with author.
29 Id.
30 Id. at 3.1.
31 Bryant, supra note 4 at 35.
32 IEN, supra note 11 at 60.
33 Bryant, supra note 4 at 35.
34 Id. at 81.
35 Bryant, supra note 4 at 35.

36 Id. at 27.
37 Georgetown Climate Center, supra note 1 at 17.
38 Virginia Tech, supra note 3 at 40.
39 IEN, supra note 11 at 81.
40 Id. at 58-59.
41 Id. at 60.
42 Id. at 63.
43 Stiles, supra note 24 at 4.1.2.
44 Id. at 4.1.4.
45 Virginia Tech, supra note 3 at 7-8.
46 Id. at 9. For specific training and funding opportunities, see id. at 44-45; see also IEN, supra note 11 at 67.
47 IEN, supra note 11 at 64.

48 Id. at 66, 68.
49 See id. at 62-63, 66-67.
50 See Virginia Tech, supra note 3 at 45.
51 IEN, supra note 11 at 63.
52 Id. at 59; Bryant, supra note 4 at 37.
53 IEN, supra note 11 at 57.
54 Virginia Tech, supra note 3 at 34.
55 IEN, supra note 11 at 57.

56 Stiles, supra note 24 at 3.1.; Virginia Tech, supra note 3 at 8.
57 See generally Stiles, supra note 24; Virginia Tech, supra note 3 at 2.
58 IEN, supra note 11 at 57.
59 See Stiles, supra note 24 at 4.1.1.
60 Id. at 3.2.

VDOT: Get the Water Moving for the Oysters

If the Virginia Department of Transportation won’t maintain adequate drainage from state highway roadside ditches to avoid flooding of private property and timber, maybe they’ll do it to provide adequate oxygen in Chesapeake Bay area waters for the oysters. Following up on yesterday’s post, this one provides information about a Smithsonian Environmental Research Center (SERC) study and where to find it online.

A Smithsonian Institution press release in February 2015 announced publication of an article, Landscape-Level Variation in Disease Susceptibility Related to Shallow-Water Hypoxia. The details may be more than the casual reader wants to absorb, but the bottom line is the SERC study describes how oysters in Chesapeake Bay area waters are more susceptible to disease when they are exposed to episodes of low dissolved oxygen at night. The locations studied had a depth of less than 6.5 feet and salinity levels typical of many of the shellfish waters around Mathews County.

“We usually think of shallow-water habitats as highly productive refuges from deep-water dead zones,” says Denise Breitburg, marine ecologist at SERC and lead author of the study. “But if low oxygen makes even these shallow waters inhospitable for fish and shellfish, the whole system may suffer.”

 So VDOT, if you don’t care about the impact on people, get the water moving so our oysters can remain healthy and help clean up the mess your negligence created.


Article Source:Landscape-Level Variation in Disease Susceptibility Related to Shallow-Water Hypoxia

Breitburg DL, Hondorp D, Audemard C, Carnegie RB, Burrell RB, et al. (2015) Landscape-Level Variation in Disease Susceptibility Related to Shallow-Water Hypoxia. PLoS ONE 10(2): e0116223. doi: 10.1371/journal.pone.0116223

Time to Pay Attention to Oxygen for the Bay

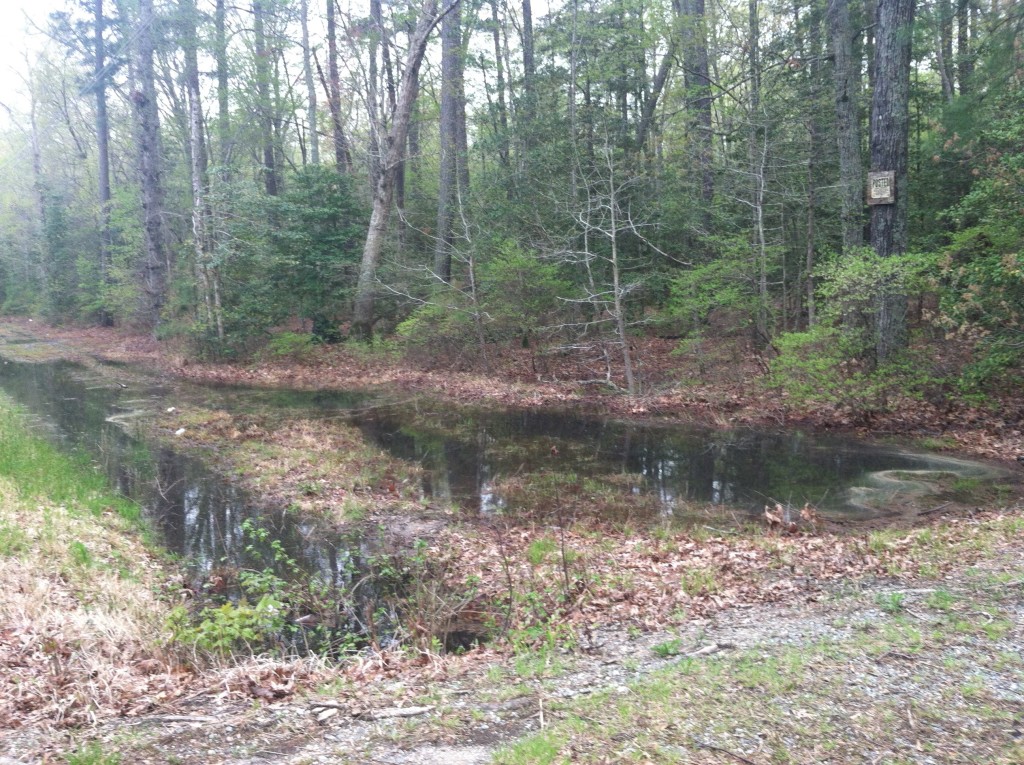
Blocked VDOT roadside ditch flooding adjacent land.

Blocked VDOT roadside ditch flooding adjacent land.

I wrote a report in 2012. If anyone in authority had paid attention then, we’d be seeing results now, instead of looking at more flooded ditches and damaged roads. Expect our TMDL numbers (total maximum daily load) for E. coli levels to stay the same, because the problem is not primarily land-based. It’s VDOT ditch based.

Although nothing about dissolved oxygen levels made it into the final EPA-accepted Water Quality Improvement Plan, there was a recommendation for a Ditch Task Force involving the Virginia Department of Transportation. The intent was to discuss and plan ways to improve the drainage for our state roads. Instead, we have the Middle Peninsula Planning District Commission advocating the creation of a Ditching Authority to charge landowners and counties for VDOT’s failures.

MPPDC is basing its Ditching Authority concept on states and countries which drained wetlands for agricultural purposes–and must continue to drain them to continue farming. Ohio, for example, drained 7.4 million acres of wetlands, and today, 2/3s of their cropland and 500,000 homes depend on that land staying drained. They have a Ditching Authority.

Our drainage problem is rainfall from state roads cannot reach receiving bodies of water because of failed and neglected VDOT maintenance. The cause is not wetland drainage, not agricultural land drainage, not private property drainage, not sea level rise, not land elevation or land subsidence.

Read the report and see for yourself if it makes sense.

Report for Working Groups for the Shellfish TMDL Implementation Plan for the Piankatank River, Gwynns Island and Milford Haven Watersheds, August 27, 2012

submitted by Carol J. Bova

A review of the original Shellfish Sanitation Surveys and outstanding violations for the Piankatank River, Gwynns Island and Milford Haven Watersheds doesn’t document enough ongoing septic system violations to account for the continuing high levels of bacteria in the TMDL waters. From the June 30th report, only Healy Creek had one prior uncorrected septic issue. There were two kitchen deficiencies: one at Healy Creek and one at Edwards Creek.

There are no large agricultural operations, fewer farms than decades ago when the waters were not impaired, and not enough hobby livestock to account for current bacterial impairments. It’s equally unlikely that pets are the main factor, and while wildlife contributes a significant amount, it is not the sole source.

Based on scientific findings over the last six years across the United States, in Canada and in Europe, naturalized E. coli is the most likely major source of the ongoing high bacterial readings.

These studies show E. coli does not require a human or animal host to survive for extended periods in soil, sand, sediments and water. Wind and storms stir up sand and sediment and release bacteria back into the water column. Bottom feeding fish like spot and croaker can take in E. coli while feeding and become carriers. Studies in Michigan show E. coli can survive 5 months in water as long as the temperature is above 39 degrees Fahrenheit. Average water temperatures for the TMDL areas only go below that in January and February and may not go that low in some years. E. coli doesn’t only survive on its own–it can reproduce if it has adequate carbon based nutrients. The presence of muck, which is partially decomposed vegetation, provides that nutrition and shelters E. coli, because no sunlight can get through it. It takes four days of sunlight to kill E. coli.

Part of the key to eliminating E. coli in the TMDL waters is to get the water clear enough to allow sunlight to penetrate. The plan to restore oysters is intended to do that, as well as filter the water, but oysters can’t live in the muck and must be suspended above it. The headwaters and some of the small inlets of the creeks are among the worst areas, with heavy muck, little circulation and probably low levels of dissolved oxygen in the water which must be addressed before oyster placement. Submerged aqueous vegetation will also benefit from more sunlight.

The long-term goal of restoring oysters is solid, but needs to be backed up with a multi-layered approach to cleaning up the waters, with a plan tailored to the characteristics of each TMDL segment. In Queens Creek, for example, at least 3-4 feet of muck exists on the sides of the channel, possibly more in the center. If the channel could be dredged to remove most of that muck, the creek could then be treated with probiotic decomposer bacteria to help break down what remains. This would create a more favorable environment for oysters and other water animals and allow sunlight to reach deeper into the water, killing even more E. coli.

Using small aeration units attached to private docks to provide additional oxygenation has been tried in Maryland. William Wolinski of Talbot County Maryland Dept. of Public Works stated the aeration used there from May through October created ‘oxygen sanctuaries’ for fish and other creatures and allowed positive bacterial action to break down sludgy sediment. A simple unit costs about $500-$600 and covers 1/4 acre placed at a 4′ depth according to one manufacturer. Any aeration provided will improve the action of probiotic bacteria in decomposing muck sediments.

Before any direct action is taken in TMDL creek headwaters and inlets, the Virginia Department of Transportation roadside ditches and related outfall ditches leading to those waters must be cleaned, pipe blockages cleared and overgrown vegetation removed to allow clean rainwater to reach the waterways. Currently, the water in outfall ditches is deoxygenated by decaying plant matter and has little to no flow except during storm events. Major storms flush the stagnant water into areas leading to the headwaters, and the load of rotting vegetation and silt with it adds to the mucky sediment already present.

The Virginia Department of Transportation should be named a stakeholder in the TMDL Implementation Plan for low dissolved oxygen levels in water in ditches which connect to TMDL waters. Credit trading should not be an option because the actions required to improve oxygenation fall within normal roadside maintenance and budget. DCR and DEQ staff can support citizen requests for a VDOT 5-year plan for roadside and outfall ditch maintenance to provide an outlet to an adequate receiving channel and body of water as required by VDOT Drainage Manual policies. This will allow clean, oxygenated rainwater to reach TMDL waters, giving other measures a better chance of success.

Sharing What We Learned About VDOT Myths and Mathews Drainage

Since the fall of 2011, I’ve been digging into the reasons for flooded land and ditches in Mathews. G.C. Morrow taught me the basics of ditches and we formed The Ditches of Mathews County project in early 2012.  We thought identifying the causes of drainage issues and working out solutions would help VDOT. When VDOT said they needed temporary easements to address outfall maintenance, we tracked owners through tax records and internet resources. G.C. visited local folks and called some who lived in other states. All were glad to help. But apparently, VDOT had other ideas.

Two small outfalls were cleaned on 609, and the water drained a considerable area that had been flooding from road drainage for years. The third project opened the outfall between Canoe Yard Trail and 609, but in the process, the VDOT contractor blocked the outlet to a second outfall. Months passed, and after the District Administrator Quintin Elliott and Resident Engineer Sean Trapani accompanied us on a tour of problem spots, VDOT finally addressed a dead tree preventing the roadside ditch on Canoe Yard Trail from draining to the outfall. But the cleaning of 609 pipes needed to drain the roadside ditches near the tidal marshes didn’t happen. The one time we know the pipe truck arrived–it came at high tide. And never came back to do the job.

We kept working on gathering information, and the story that emerged was not a pretty one. Going through the Board of Supervisors’ meetings, month after month for thirty-odd years was a test of endurance. Transcribing key sections and sorting by topic and choosing which statements would illustrate the ongoing saga felt like an impossible task for a time. Eventually, though, the outline emerged showing how three years of VDOT/County revenue sharing projects ran on into the sixteenth year, and how those involved seemed to forget the original reason for the projects.

It’s all laid out now in Drowning a County, and everyone reading it will see what happened and when, and more importantly, what didn’t happen that should have. The pattern of County Supervisors and Administrators forgetting or overlooking details of agreements with VDOT and accepting incorrect statements without challenge cannot be allowed to repeat itself now and in future years. Drowning a County can provide the facts and the history to help our leaders and our citizens avoid being misled even once more by VDOT mythology.


MAIN STREET DRAINAGE IMPROVEMENT

DESIGN PUBLIC HEARING

DECEMBER 12, 2012

5-7 PM THOMAS HUNTER MIDDLE SCHOOL

Public Meeting notice in Gazette Journal 11/15/12

The meeting will only cover Main Street drainage from Hyco Corner to Kingston Parish Hall, and comments will be limited to that area.

Wondering why now? Why no mention at the October board meeting? Why no documents are available for inspection in Mathews?

The Ditches of Mathews County

Route 611/Church Street in Mathews looking towards Rt. 14

The latest picture story on Facebook by The Ditches of Mathews County shows a small section of Church St/Route 611 going from Mathews Courthouse towards Rt. 14. Wish I could say this level of vegetation is an unusual situation, but it’s becoming the norm with the reduction in VDOT mowing cycles as a cost-saving measure. The question then becomes: How much is this going to cost in the long run when so many cross pipes are blocked?  Each blocked ditch section becomes a mini-lake and young trees and marsh grasses and weeds in general are flourishing undisturbed.