Date: December 22, 2015
To: Keith R. Goodwin, keith.r.goodwin@usace.army.mil
CC: Joe Schumacher, Congressman Wittman’s office
Mathews County Supervisors
RE: NAO-201501451 Chesapeake Bay Wetland Mitigation Bank
The prospectus for the referenced mitigation bank fails to adequately address issues of public health and safety, potential East River water quality impacts, and conflicts with the Mathews County Comprehensive Plan. A number of responses to the Virginia Off-Site Mitigation Location Guidelines Checklist are factually inaccurate. Contrary to the responses, the riparian areas of the East River are on adjacent properties except for a small fringe of the RMA in the southeastern corner of the site, and a residence is currently under construction on a parcel adjacent to the site. While the risk of lead contamination of the groundwater which connects to the Yorktown-Eastover aquifer, the primary and generally only source of drinking water for Mathews County, is of the utmost concern, consideration of the impacts of reduced water flow to the East River is important to the health of the river and the Chesapeake Bay. The other issues raised here need to be considered as well.
Thank you,
Carol J. Bova
Concern about Lead Contamination of Groundwater and Aquifer
The initial lead remediation plan for the proposed mitigation site on Route 14 will stop unless a subsequent random soil test is higher than 400 ppm, which is equal to 400,000 ppb. The EPA action level for lead in drinking water is 0.15 mg/liter, which equates to 15 parts per billion, yet the remediation plan does not address the possibility of lead leaching into groundwater during the five years of shooting range activity which uses approximately 2,188 pounds of lead shot annually. No water testing is included in the prospectus or lead remediation plan even though the Yorktown-Eastover, the primary aquifer for domestic wells, is 7 feet below the surface of the ground as recorded in the USGS borehole about 1.5 miles southwesterly on Route 14 from the site, and the aquifer is in contact with groundwater in many places.
“The Yorktown-Eastover aquifer and the eastern part of the surficial aquifer are closely associated…and jointly compose a shallow, generally semiconfined groundwater system that is hydraulically separated from the deeper system.” (USGS Professional Paper 1713, Abstract. http://pubs.usgs.gov/pp/2006/1731/pp1731_download.htm)
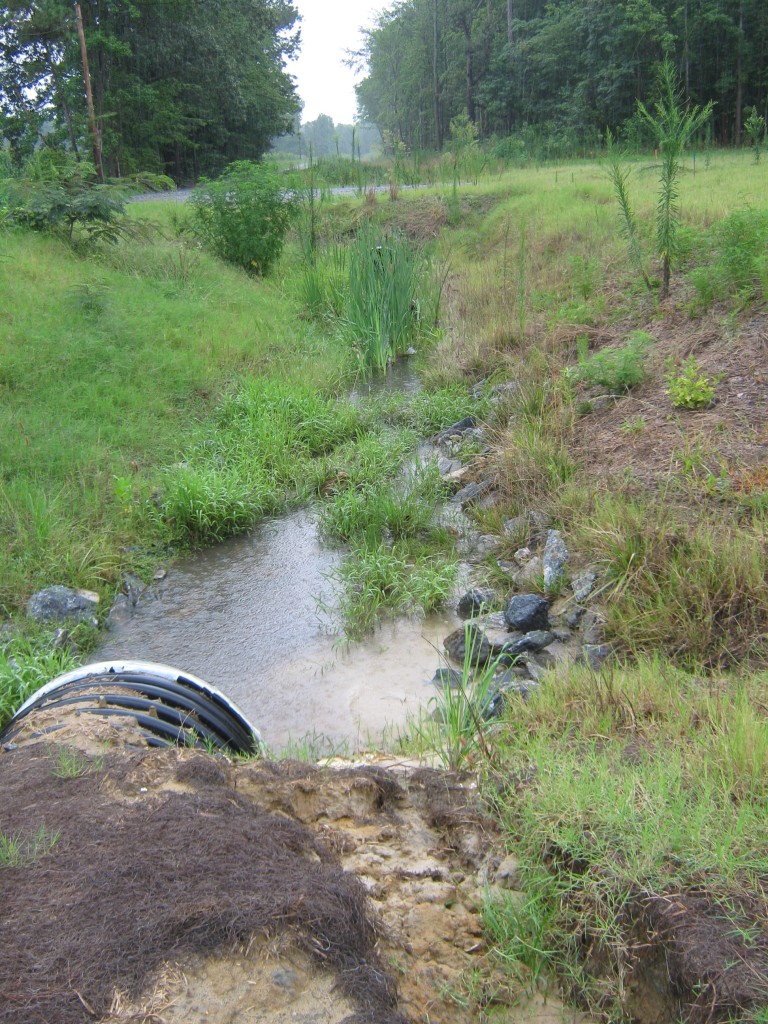
The National Wetlands Inventory shows 6.28 acres of land designated as temporarily flooded overlaying part of the shooting range fallout zone. This is not shown on the prospectus site map. Even if that area is no longer flooded, the remediation plan does not follow the Technical/Regulatory Guidelines of the Interstate Technology and Regulatory Council regarding runoff. (See page 6–NWI map detail with 5 areas marked where precipitation runoff crossed Honey Pod Lane to the East River in December 2015.)
“Nearby surface waters or wetlands that could be receiving runoff from the areas of the ranges where shot or bullets are deposited should also be noted, and the sampling and analytical plan should investigate this possibility.” (http://www.itrcweb.org/GuidanceDocuments/SMART-1.pdf)
Annual rainfall for this area is about 45 inches. The U.S. Army’s report, “Prevention of Lead Migration and Erosion from Small Arms Ranges” discusses effects of saturated soil on corrosion and lead migration with shallow depth to groundwater not addressed in the prospectus.
“Rainfall also influences the solubility of lead. The more rainfall, the greater the likelihood the soil will become saturated, increasing the time the round stays in contact with the rainwater. The longer the round stays in contact with moisture, the faster it will corrode. Acid rain accelerates the corrosion process.
“The risk of lead migration to groundwater becomes greater when the corrosion rate is high and depth to groundwater is shallow (less than 10 feet). Basically, the closer the groundwater is to the surface, the greater the chances of contamination.” (http://www.aec.army.mil/Portals/3/range/leadmigration.pdf)
According to EPA’s Best Management Practices for shooting range operation, sandy soils, high annual rainfall, and a water body downslope of the range increase the risk of lead migration and contamination. (http://www3.epa.gov/region02/waste/leadshot/epa_bmp.pdf)
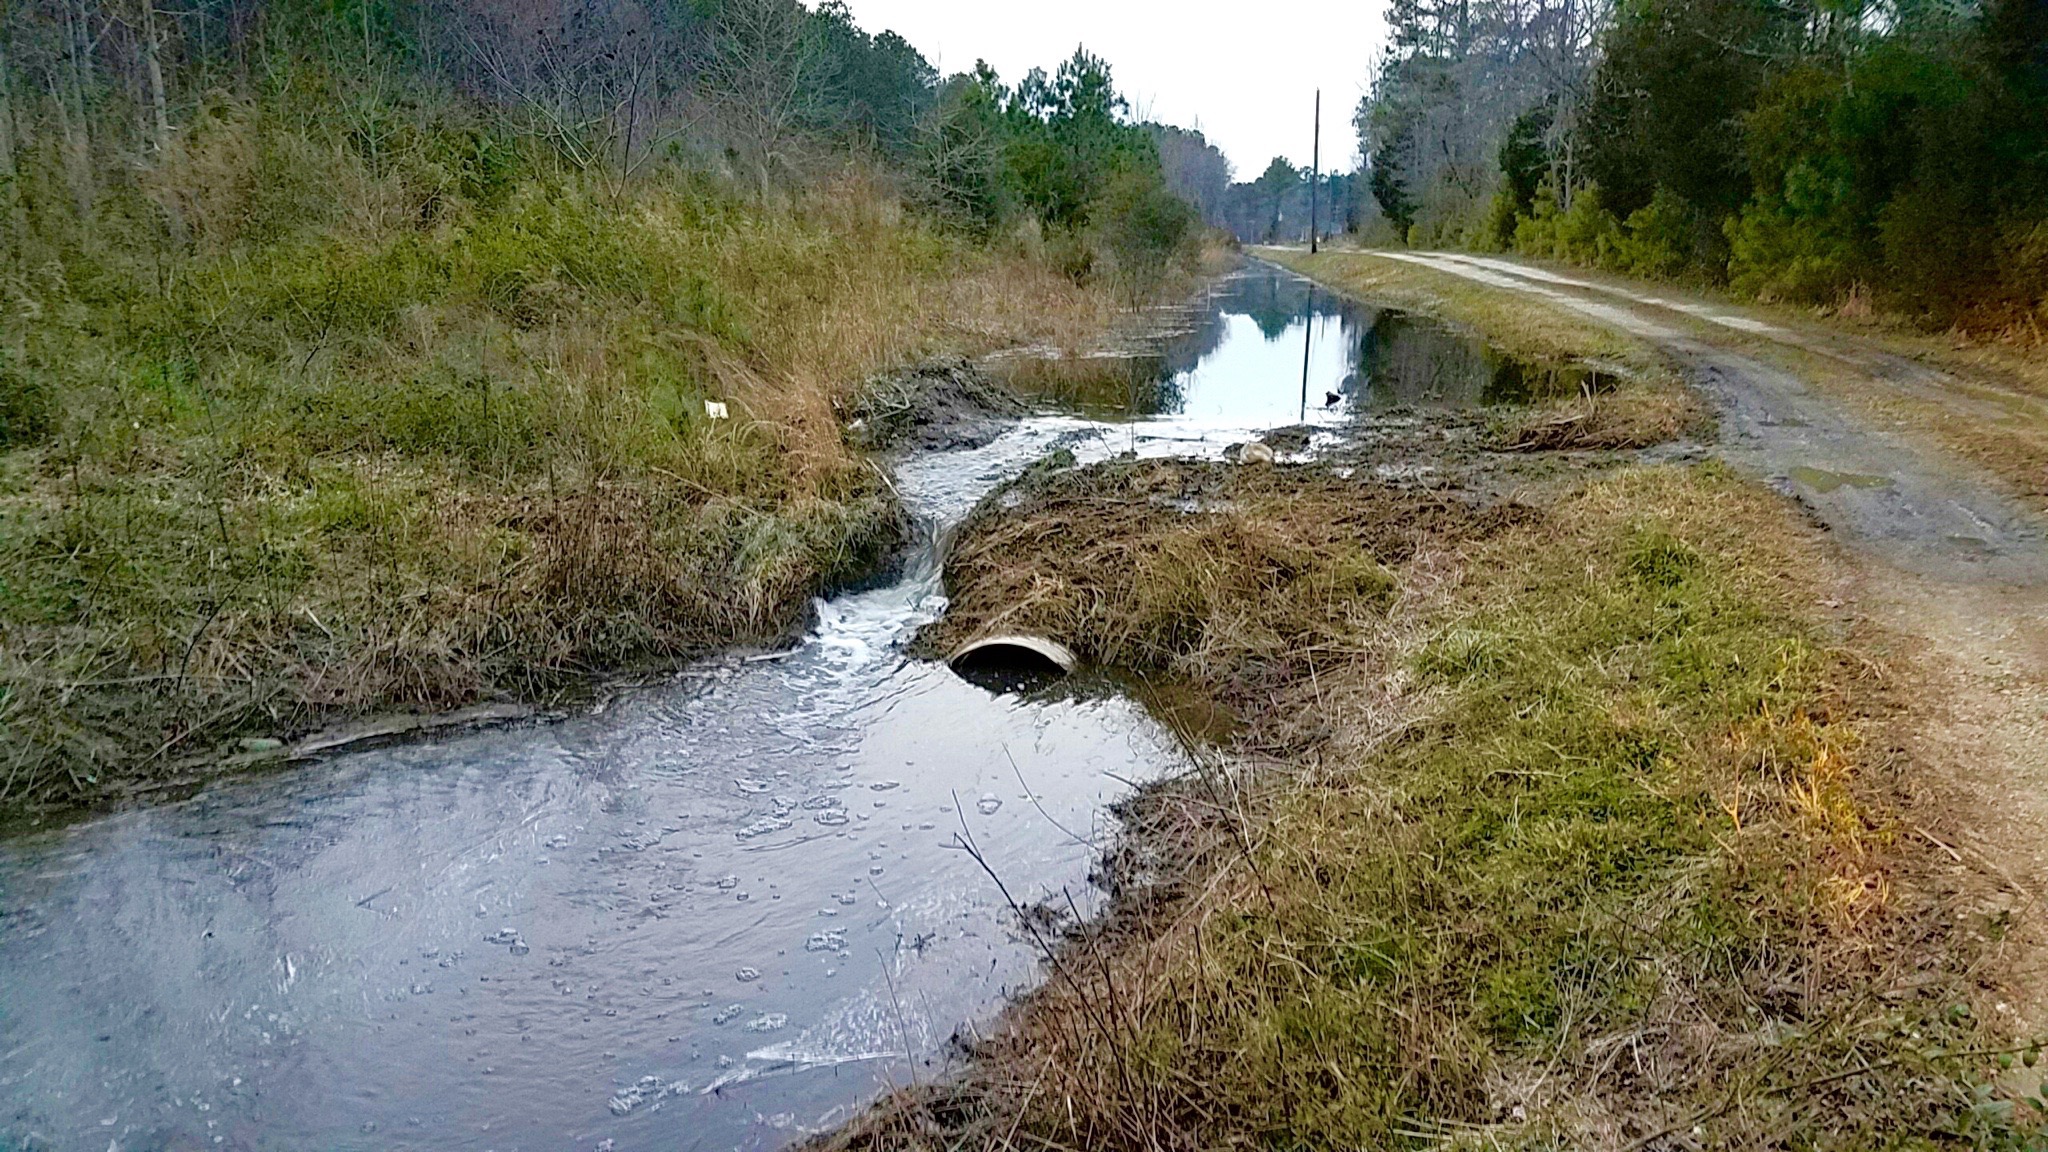
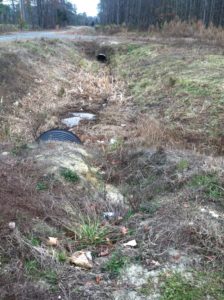
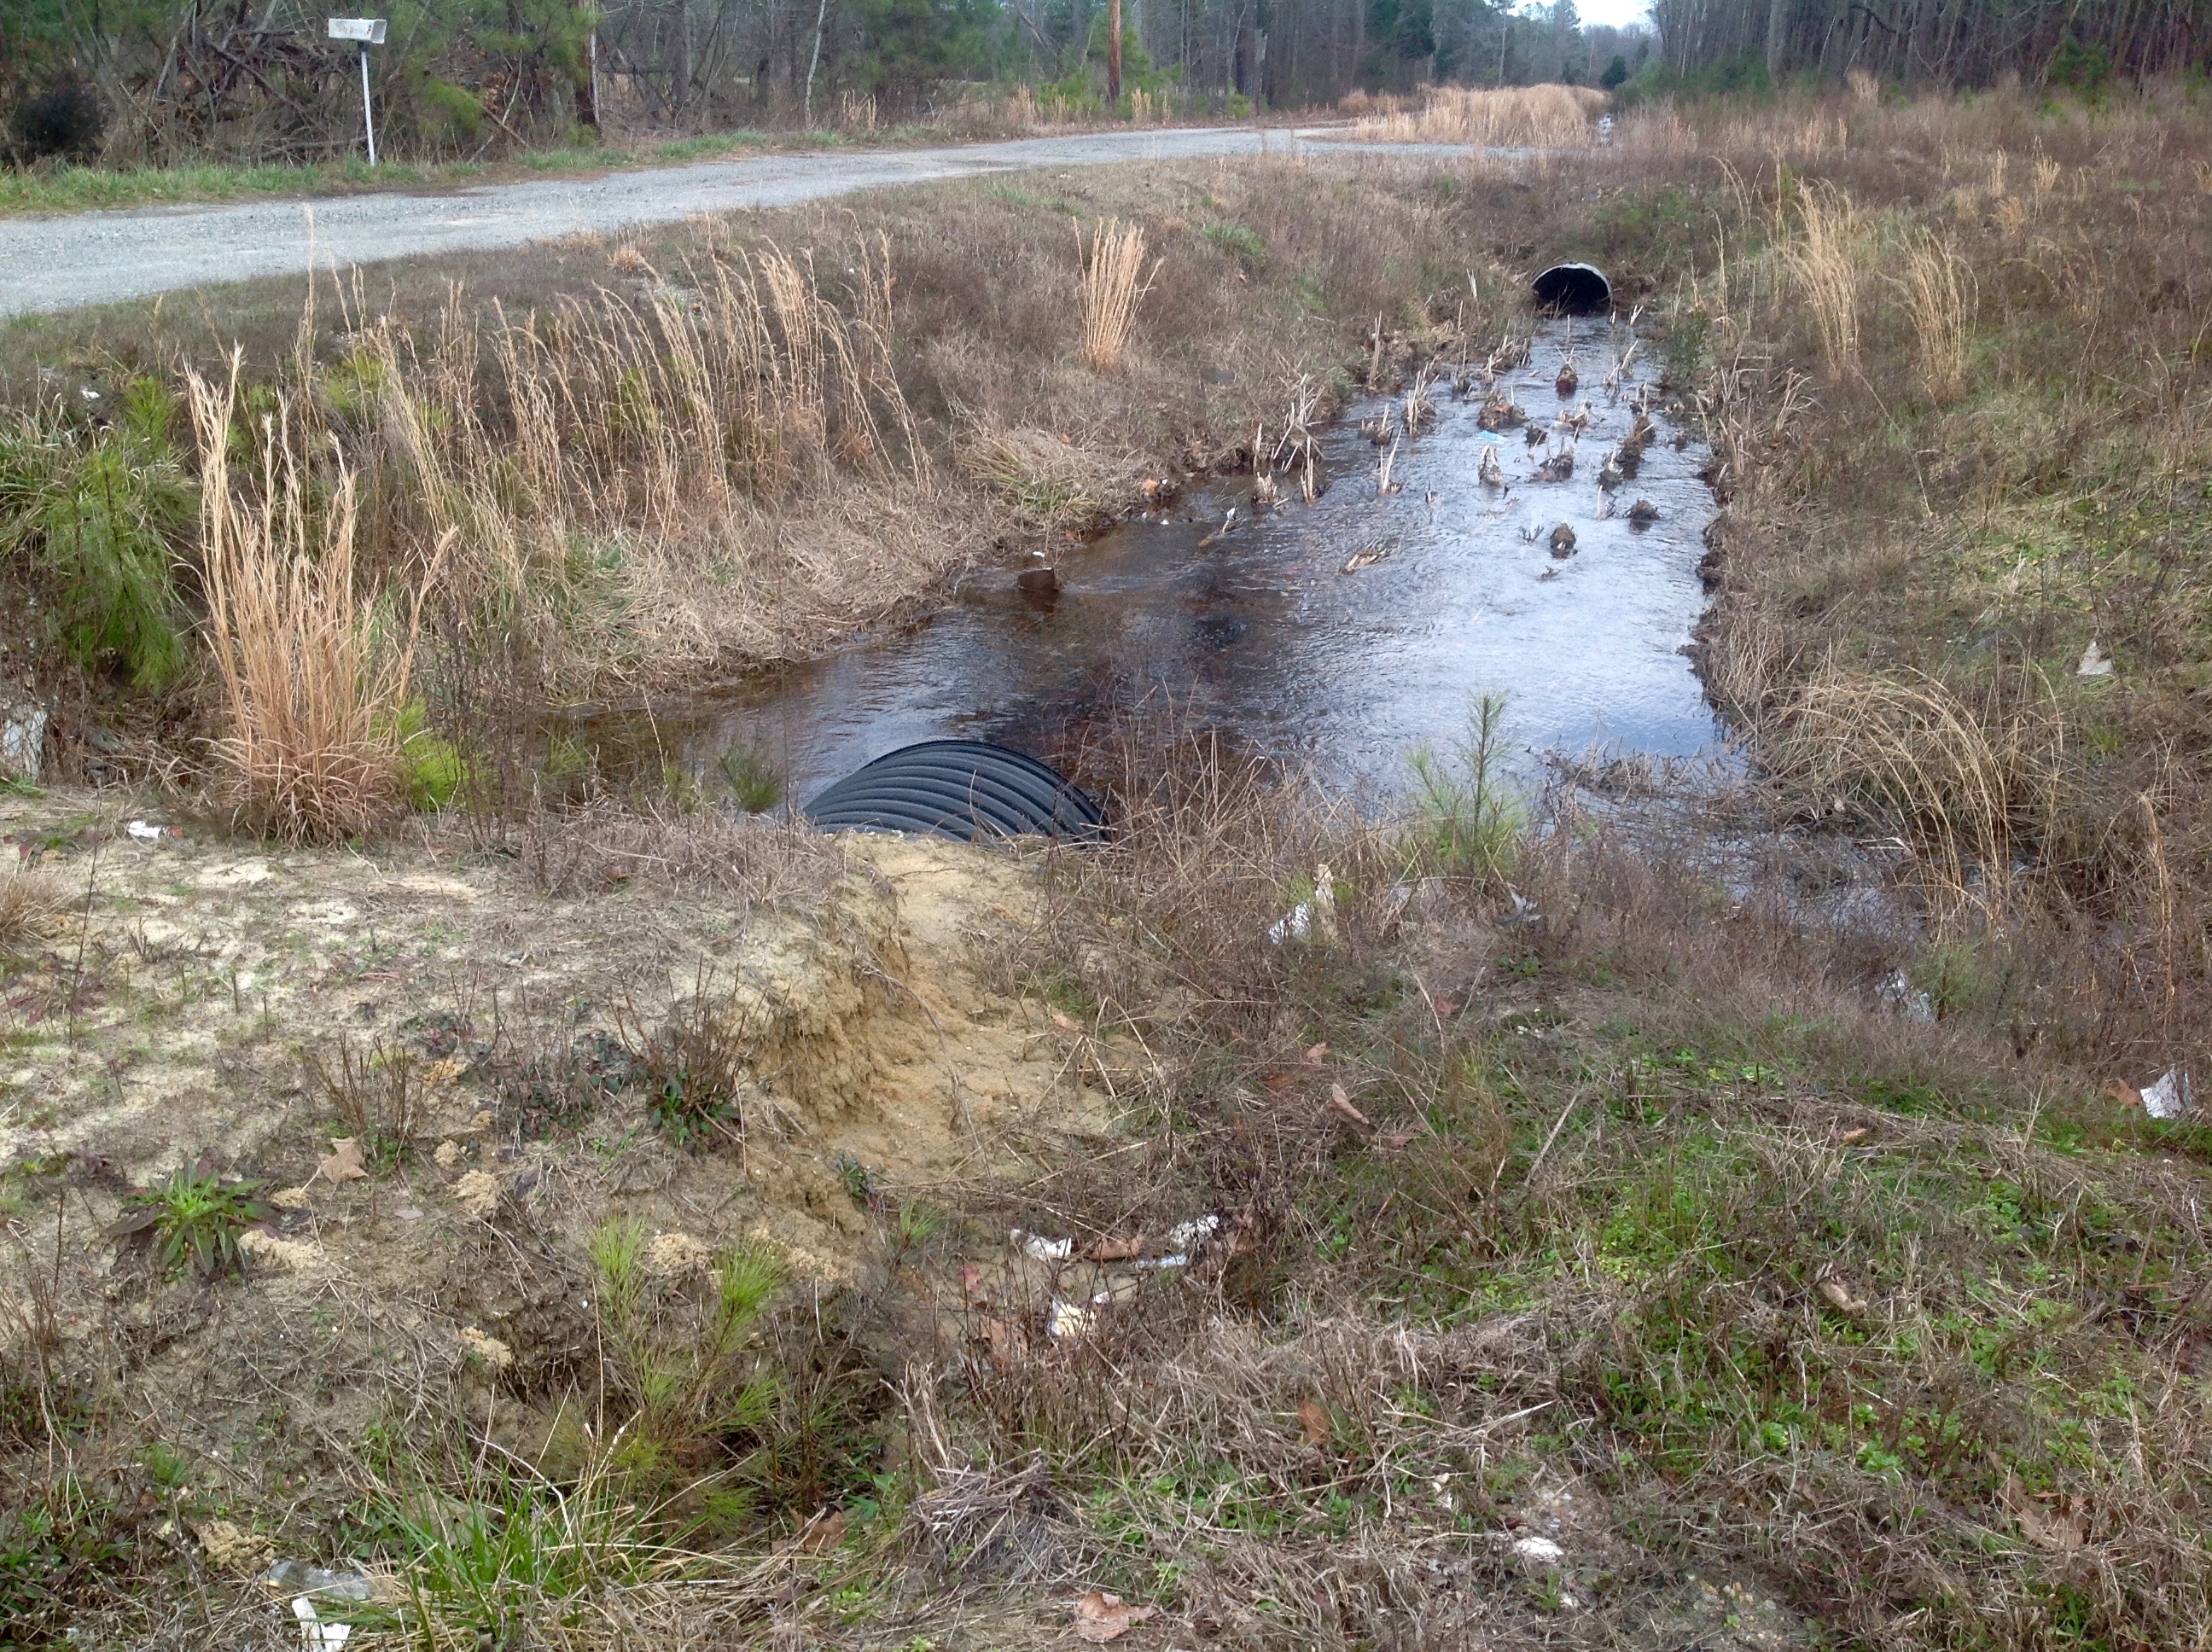
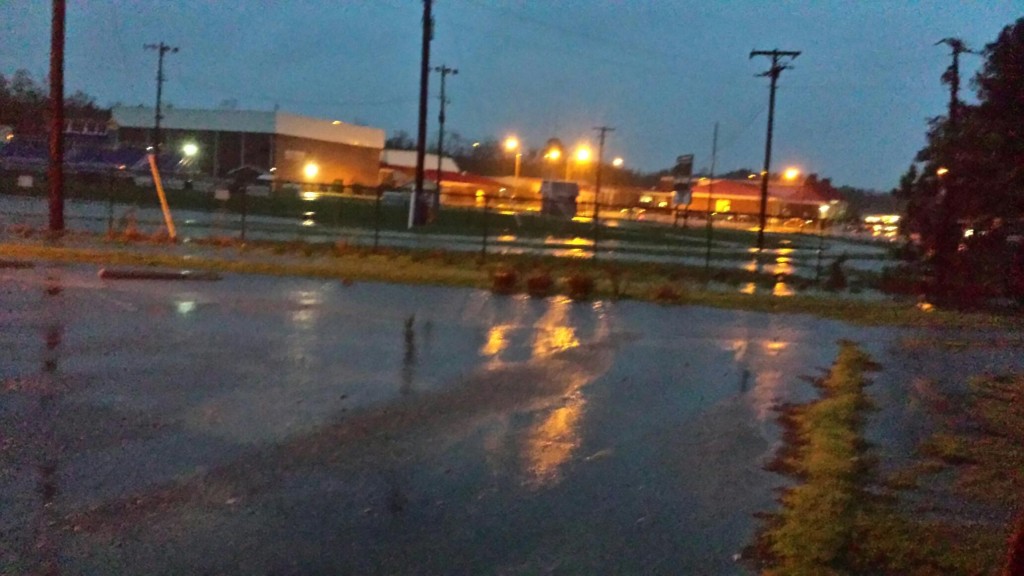
Runoff from the proposed site was observed in five locations crossing Honey Pod Lane from west of the site in December 2015 after a moderate amount of rainfall. (See page 6.)
The remediation plan for lead in the soil will not start until 2018 while lead could be leaching into the groundwater or be in runoff to the East River in the five years before then.
Negative Impact of Berms and Blocking Drainage on East River Water Quality
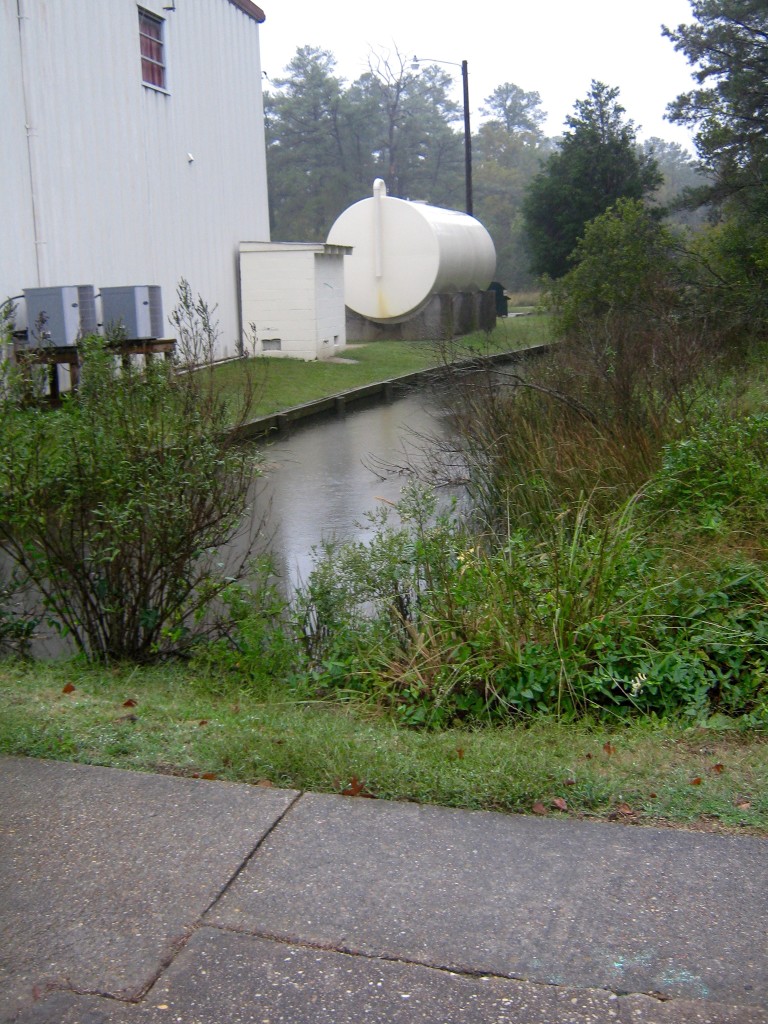
Although the environmental specialist for the sponsor told the Mathews Board of Supervisors on December 15 there would be the same three discharge sites, he also said there will actually be less water coming off the site because of planting trees. “We’re decreasing the flow off the site.” The prospectus describes the plan to raise the site’s groundwater level by blocking the existing drainage channels on the property and building berms which would seem to indicate less water will reach the river from those changes as well.
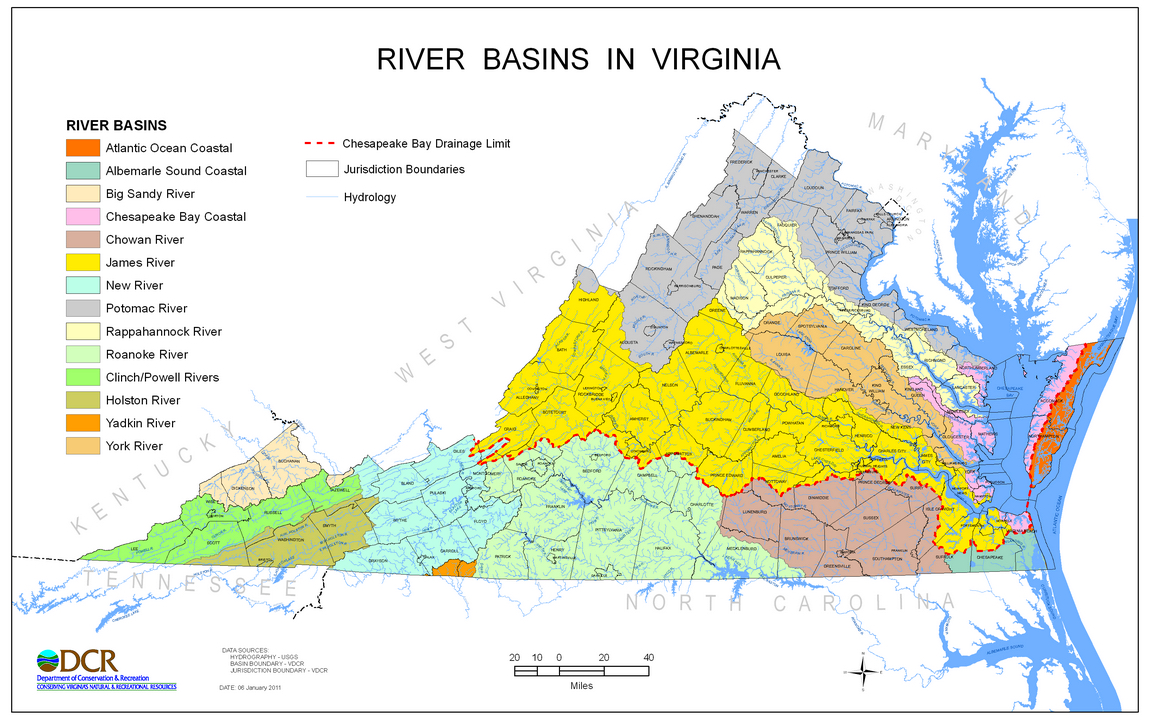
The East River has two Category 5 impairments on the state’s 2014 303D(1) report which can be worsened by reduced water flow: pH exceedance in 8 of 12 months and low dissolved oxygen. The East River TMDL review is not scheduled until 2024, so any worsening of impairments will impact the Chesapeake Bay water quality at least until that time.
Inaccurate Statement about Fallsington Soil
The prospectus states, “…most of the surrounding property has Fallsington Soils, which are not suitable for drainfields.” This is not an accurate statement because suitability is site-dependent. Fallsington soil is present in much of the County and can be suitable for septic systems. The “User Notes for National Wetlands Inventory Maps of Eastern Virginia” lists the Fallsington Soil Series with an asterisk: “Requires site evaluation to determine whether soil is wetland.” The presence of five homes adjacent to the proposed site and one under construction would also confirm this fact.
A follow up review for the Piankatank/Gwynn’s Island/Milford Haven TMDL IP was made in August 2015 for septic system deficiencies, repairs and replacements in Mathews County, including the East River watershed (Shellfish Growing Area 41), surveyed by the Virginia Health Department, Division of Shellfish Sanitation. Growing Area 41 has 983 homes, and there were 14 septic system repairs over a three-year period (2013-2015), a rate of 1.42 percent and 6 replacements, a rate of 0.61 percent, well below the failure rate used in the Piankatank TMDL Water Quality Improvement Plan.
Although the environmental specialist said at the December 15 meeting there would be no impact on adjacent homeowners from surface flow, neither he nor the prospectus discussed the sub-surface effect on downslope drainfields of raising the water table on the mitigation site which is at a higher elevation. No statements were made as to current depth of groundwater on the mitigation site or adjacent properties.
Comments on Sponsor’s Answers to Off-Site Mitigation Guidelines Checklist
B1. Wetland Restoration: Yes
B2. Stream Restoration: No.
It is questionable whether this is a wetland restoration.
- “Most of the marshes along the North and East Rivers are fringing marshes along the adjacent uplands…” (Mathews County Shoreline Management Plan, Virginia Institute of Marine Science, Shoreline Studies Program, March 2010.)
There are no marshes on the site which would indicate the site was historically uplands.
Mathews County is a watershed discharge zone for the Chesapeake Bay through its streams, creeks and rivers. Ephemeral streams flow only after rains fall and are rarely indicated on maps. Mining of sand on the site in the 1930’s and farming prior to and after that time would have disrupted the natural ephemeral streams that would have conducted water to the East River, leading to the establishment of drainage ditches on the site.
- Spot elevations from the National Map show most of the property is about 12 feet in elevation, with one measurement of 14 ft midway down the eastern boundary ditch which runs from state Route 14 to the East River. The site is higher than 2/3s of West Mathews according to the Comprehensive Plan, and it is in Zone X outside the 500-year floodplain. See page 7 for FEMA Flood Hazard Map.
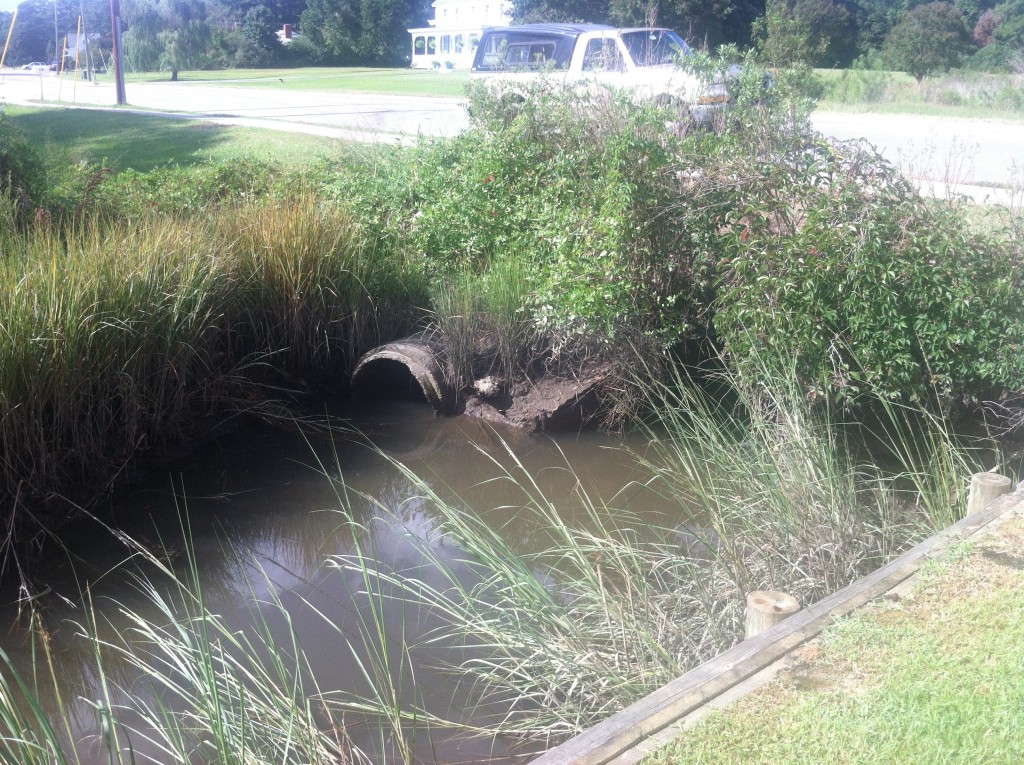
B3. Sponsor states the site is contiguous or connected to other aquatic areas.
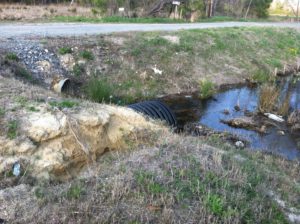
- There is no description of this connection in the prospectus beyond the image of the drainage ditch on the east property line. There is no acknowledgement of the existence of the historically present intermittent stream. See pages 8-9 for adjacent properties between the site and East River.
B4. Sponsor states no existing or proposed development upslope/adjacent to the project.
- A residence is currently under construction immediately to the west of the project at 166 Honey Pod Lane.
B4. Sponsor also states no areas are identified for future development in the Comprehensive Plan upslope and adjacent to the proposed mitigation site.
- The Comprehensive Plan designates the upslope northern property border as part of a 300-foot wide Corridor Overlay District along Route 14 and for Waterfront Residential along the west and south borders. See page 10.
B5. Sponsor claims riparian buffer protection greater than state and local requirements.
- The only riparian buffer may be in a small area within the RMA on the southeastern edge of the property. Any other buffers would be on adjacent properties. See page 11, Comprehensive Plan Chesapeake Bay Protection Areas map. If tree seedlings are able to take hold when planted, it would be a number of years before they can take up any significant amount of water.
B7. Sponsor claims the site is consistent with local planning requirements.
- In fact, there are no zoning ordinance statements that apply except Section 15.8 which prohibits land use that creates “…noxious, or otherwise objectionable conditions which could adversely affect the surrounding areas or adjoining premises.” Freshwater wetlands without environmental conditions that allow wet/dry cycles to keep soil oxygenated produce methane and can produce hydrogen sulfide. The environmental specialist James Hudson told the Board of Supervisors on December 15 there would be standing water above the surface in the winter wet season.
- The following excerpt from class notes from the University of Arizona’s College of Agriculture and Life Sciences describes wetlands methane production.
Nutrient cycling in wetlands:
“The diffusion of oxygen in saturated soils is 10,000 times slower than in unsaturated soils. A saturated soil will become anaerobic in a matter of hours (matter of days at most) depending on 1) temperate; 2) the amount of organic matter; 3) the initial microbial community and 4) the amount of reducing compounds present (example: ferrous iron)….Methanogenic [methane-producing] organisms work in the anaerobic zone to convert dissolved organic carbon into methane…..The production of methane is much more common in freshwater systems.” (http://cals.arizona.edu/azaqua/aquaplants/classnotes/NutrientCycling.pdf)
B8. Sponsor states order of stream on site is not applicable.
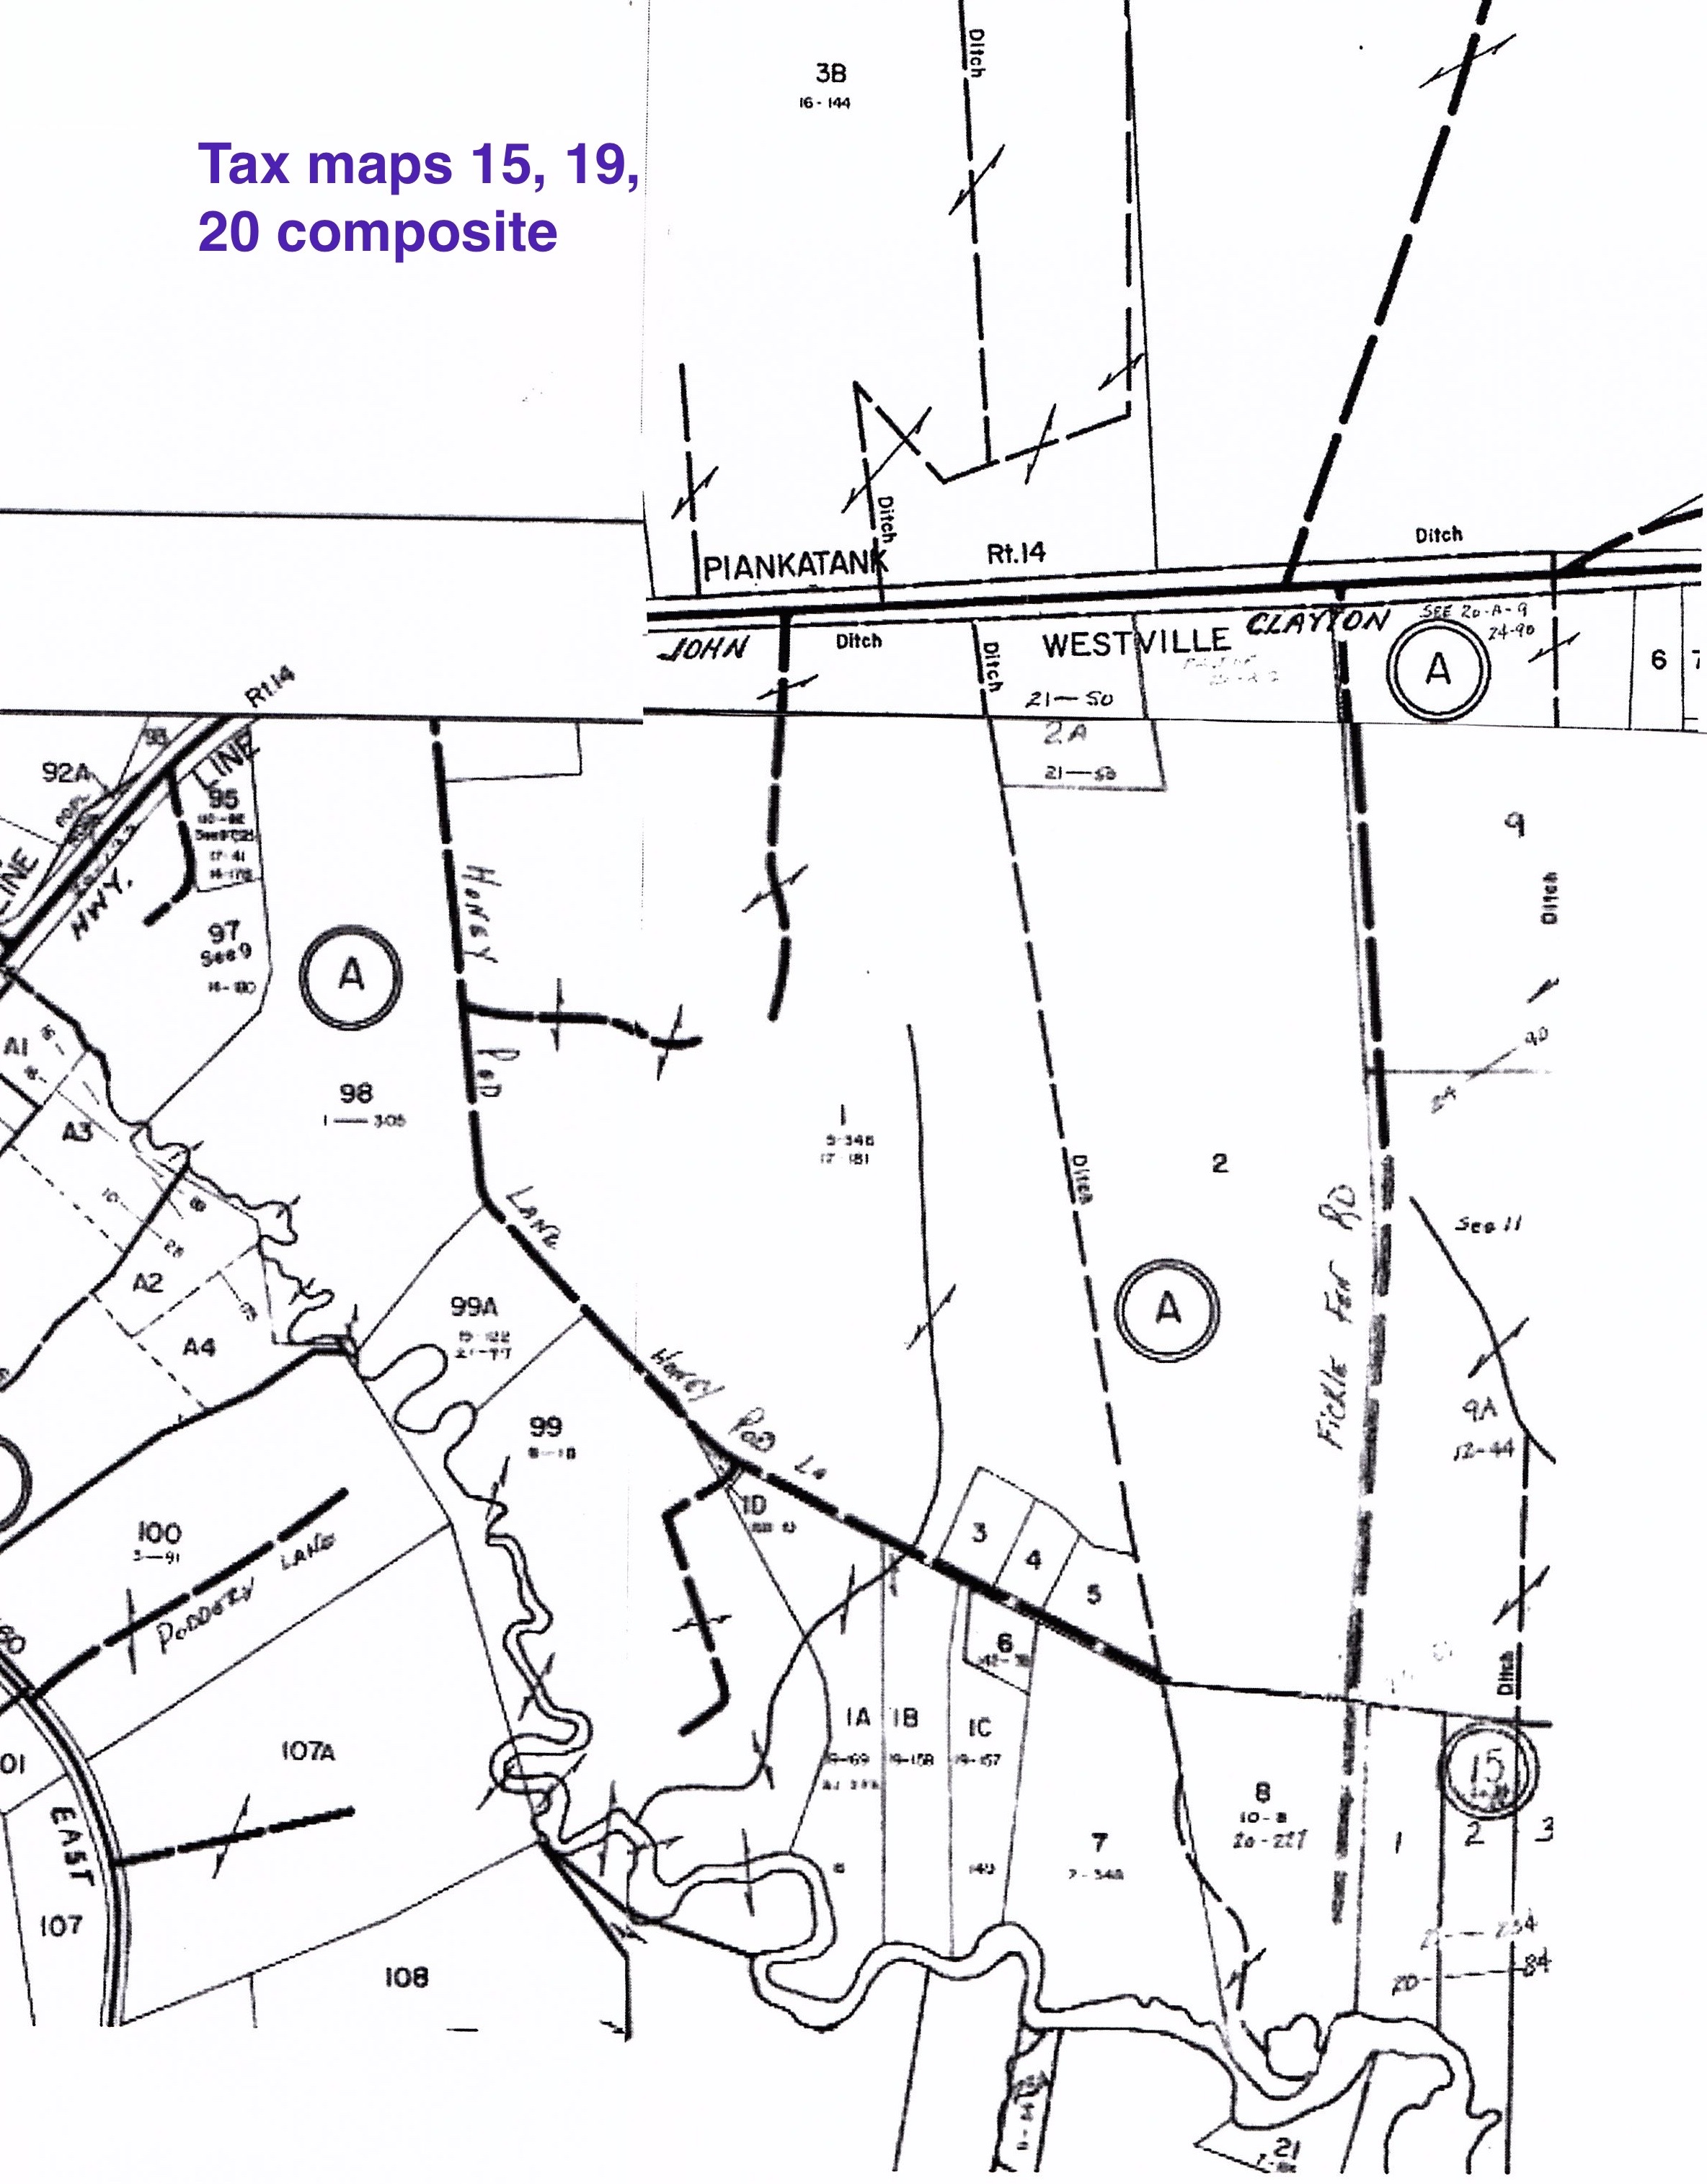
- An intermittent first-order stream is clearly shown running to the south through the shooting range fallout zone on USGS 1948, 1965, and 2013 topographic maps, the National Map, and Mathews County Tax Map 20. It may have been damaged or disrupted by the previous clear-cut logging and the establishment of the shooting range. The temporarily flooded area shown on the National Wetlands Inventory may be evidence of this intermittent stream. (See National Wetlands INventory detail, Mathews County Tax map composite, and National Map Hydro-Imagery detail.)
C1. Sponsor states the site creates/contributes to a corridor linking large aquatic systems.
- The property is separated from the East River by 93 acres in 12 adjacent parcels of land. See List of Properties and Tax Map Composite.
C5. Sponsor states the site will contribute to improved water quality for identified/ designated impaired waters described as “shellfish/not supporting.”
- In spite of previous improper farming practices referred to in the prospectus as contributing sediment and nutrients to the East River, the Virginia Department of Environmental Quality reports no East River nutrient or sediment impairments.
- The shellfish impairment is for E. coli. Reducing flow of precipitation runoff to the East River will not reduce E. coli levels in the river.
C8. Sponsor states the proposed site is “at the top of the watershed.”
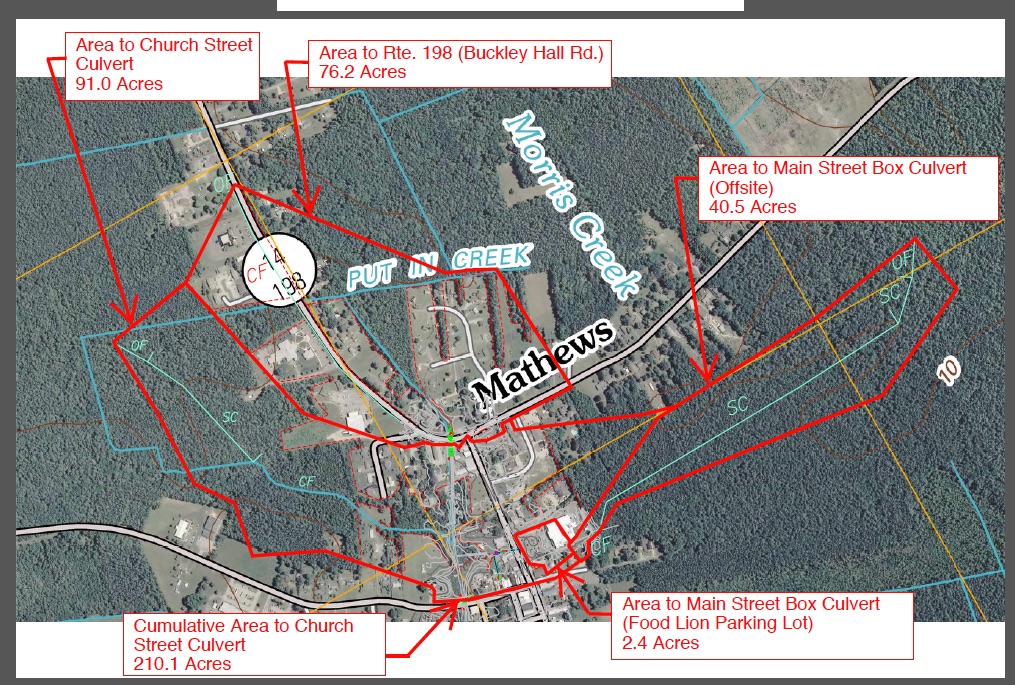
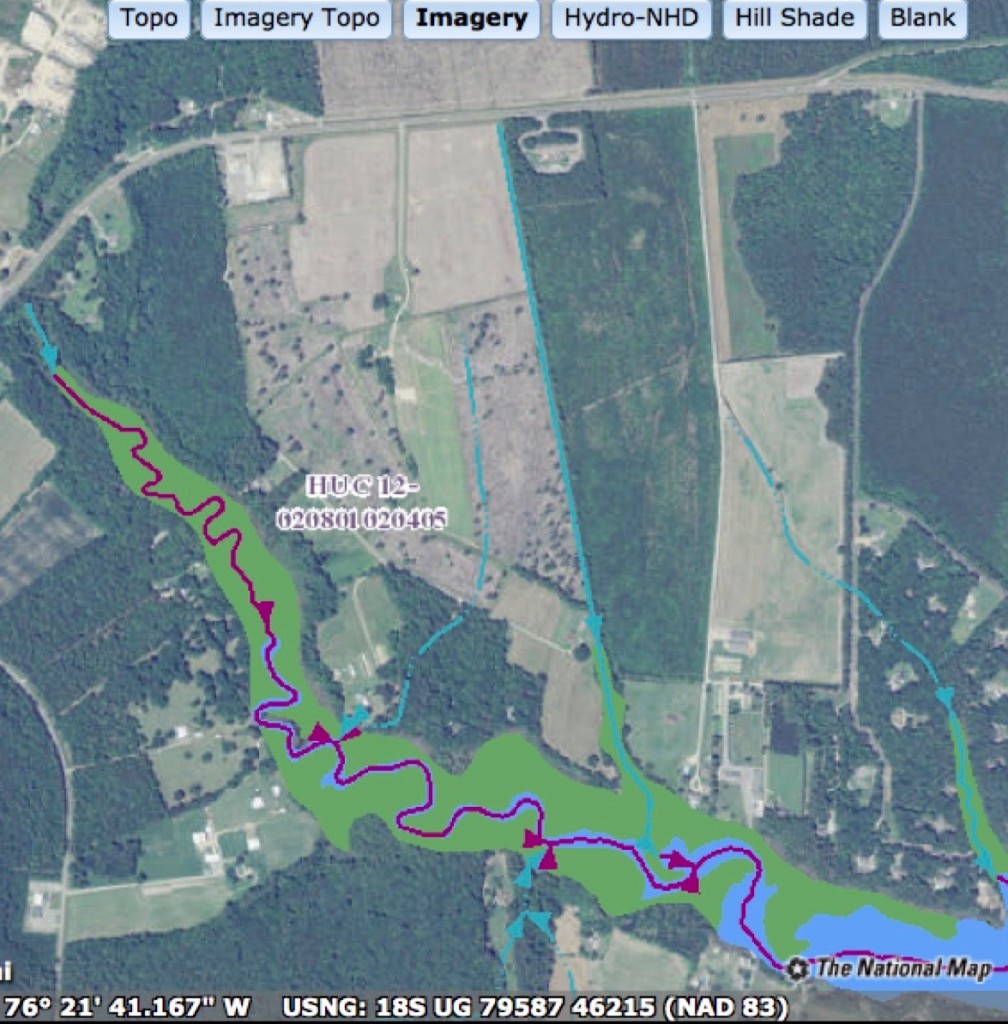
- The site is at least 1 mile south of the ridge separating the East River Watershed HUC12-020801020405 from the Lower Piankatank River Watershed HUC12-020801020403. Virginia Department of Transportation project plans for Route 14, 14-667C, sheet 7, show two notations of 600 and 675 acres of drainage being carried across the road from the northwest to the East River just west of the proposed mitigation site. See National Map watershed boundary detail below.
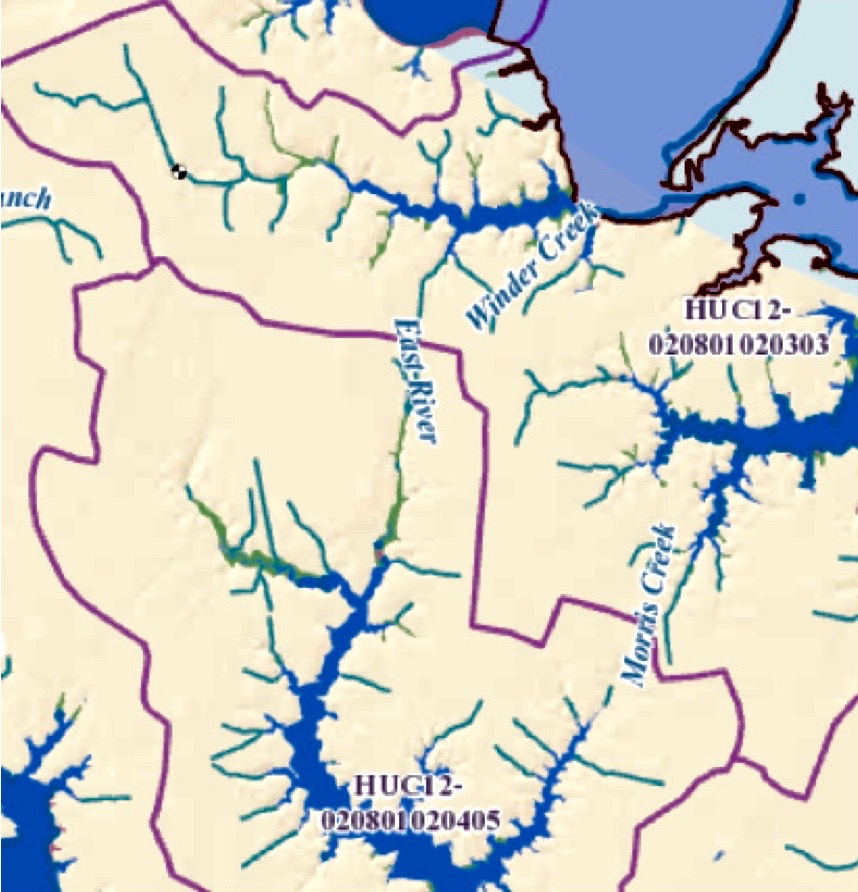
Watershed Boundaries in purple from National Map. (Color enhanced for better visibility.)
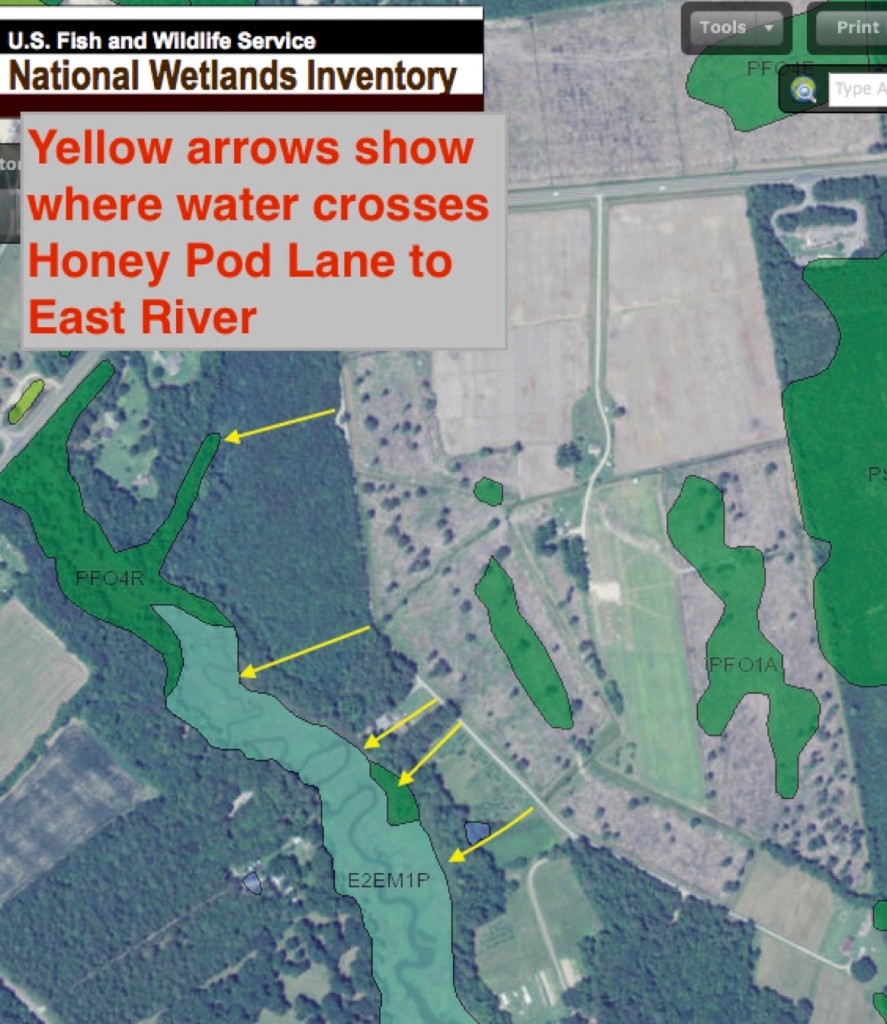
Yellow arrows placed on National Wetlands Inventory map show runoff channels crossing Honey Pod Lane from proposed site.
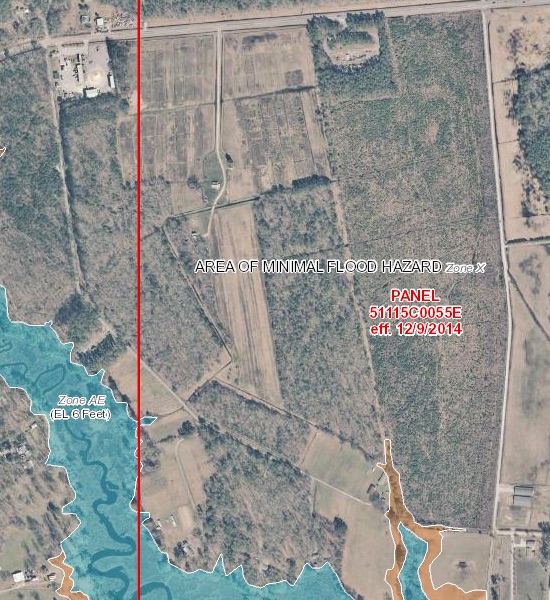
FEMA Flood Hazard Map Layer showing proposed site is in Zone X.
Properties Between Proposed Site (tax map 20-A-1) and East River (see Tax Map below list)
Adjacent waterfront properties with residences:
19-A-98 29.40 acres 166 Honey Pod Lane (Norton) (Under construction.)
19-A-99A 5.06 acres 366 Honey Pod Lane (Hurst)
19-A-99 27.37 acres 524 Honey Pod Lane (Walsh)
20-A-1A 6.93 acres 620 Honey Pod Lane (Hudgins)
20-A-1B 5.35 acres 652 Honey Pod Lane (Hurst)
Adjacent non-waterfront with residence:
20-A-5 1.24 acres 755 Honey Pod Lane (Jenkins)
Adjacent non-waterfront properties with no residences:
20-A-1D 0.07 acres (Walsh)
20-A-3 2.03 acres (Ingram, C.)
20-A-4 0.71 acres (Jenkins)
Parcels between adjacent properties and East River
20-A-1C (Waterfront with residence) 4.00 acres 674 Honey Pod Lane (Owens)
20-A-6 (Non-waterfront, no residence) 1.01 acre (Ingram, C.)
20-A-7 (Waterfront, no residence) 10.06 acres (Ingram, A.)
Total 93.23 acres between site and river.
Adjacent to eastern property border
20-A-2 54.30 acres (Gayle) Along eastern ditch.
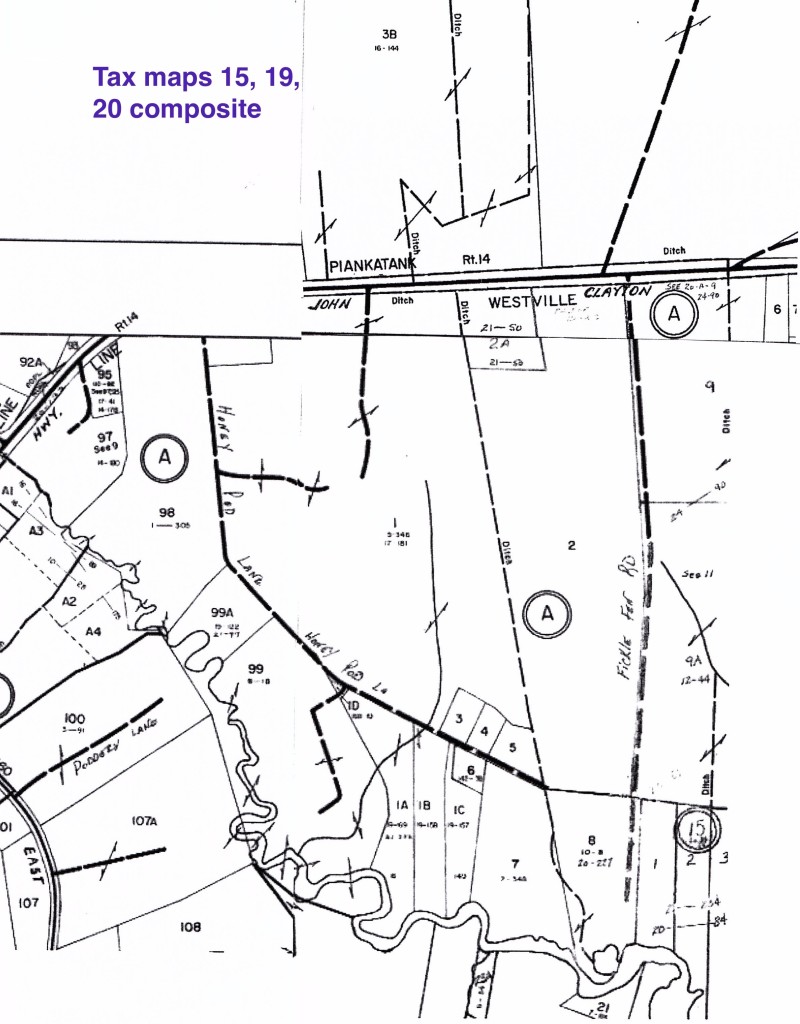
Composite of Mathews County tax maps 15, 19 and 20 to show proposed site and adjacent properties. Intermittent stream is solid light line between Honey Pod Lane and double-circle A.
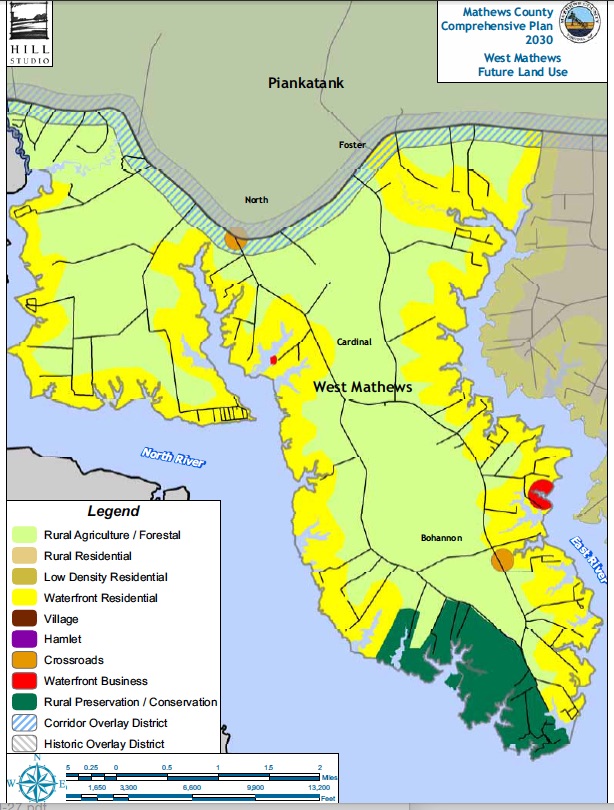
Comprehensive Plan map showing West Mathews Future Land Use.
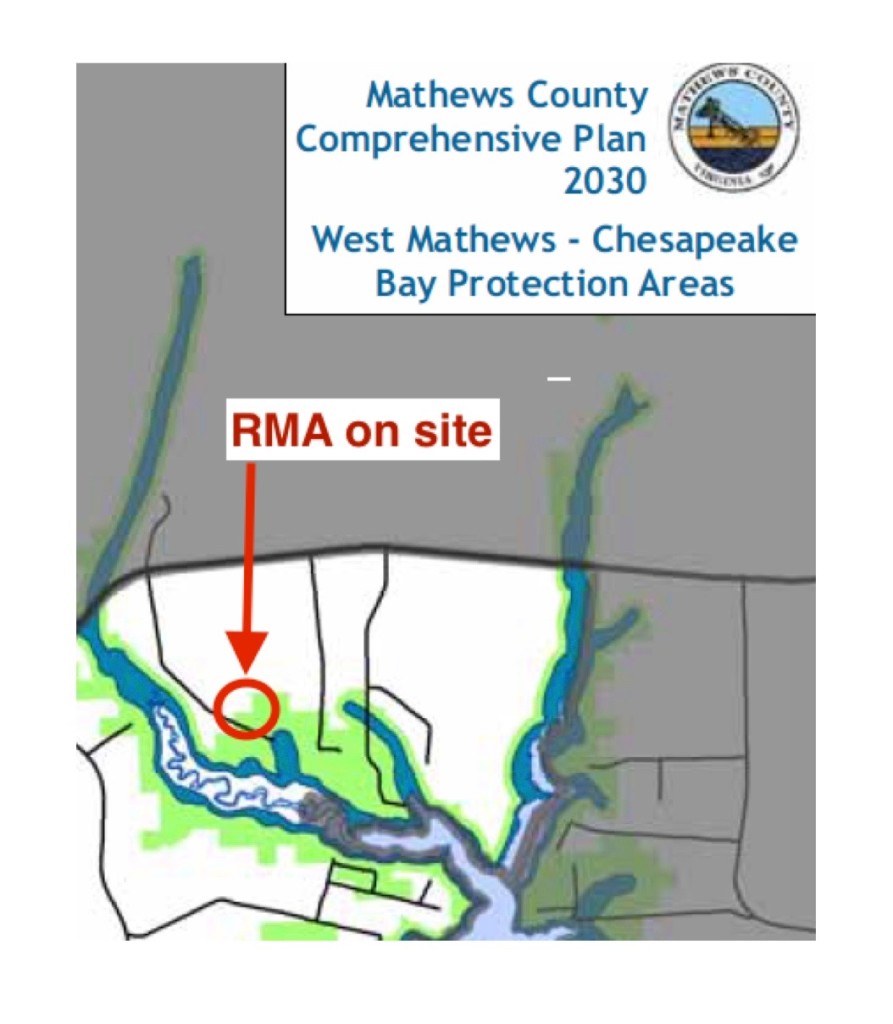
Mathews County Comprehensive Plan showing West Mathews Chesapeake Bay Protection Areas. RMA on proposed site circled in red.
National Map Hydrography view showing intermittent stream on proposed site and East River.