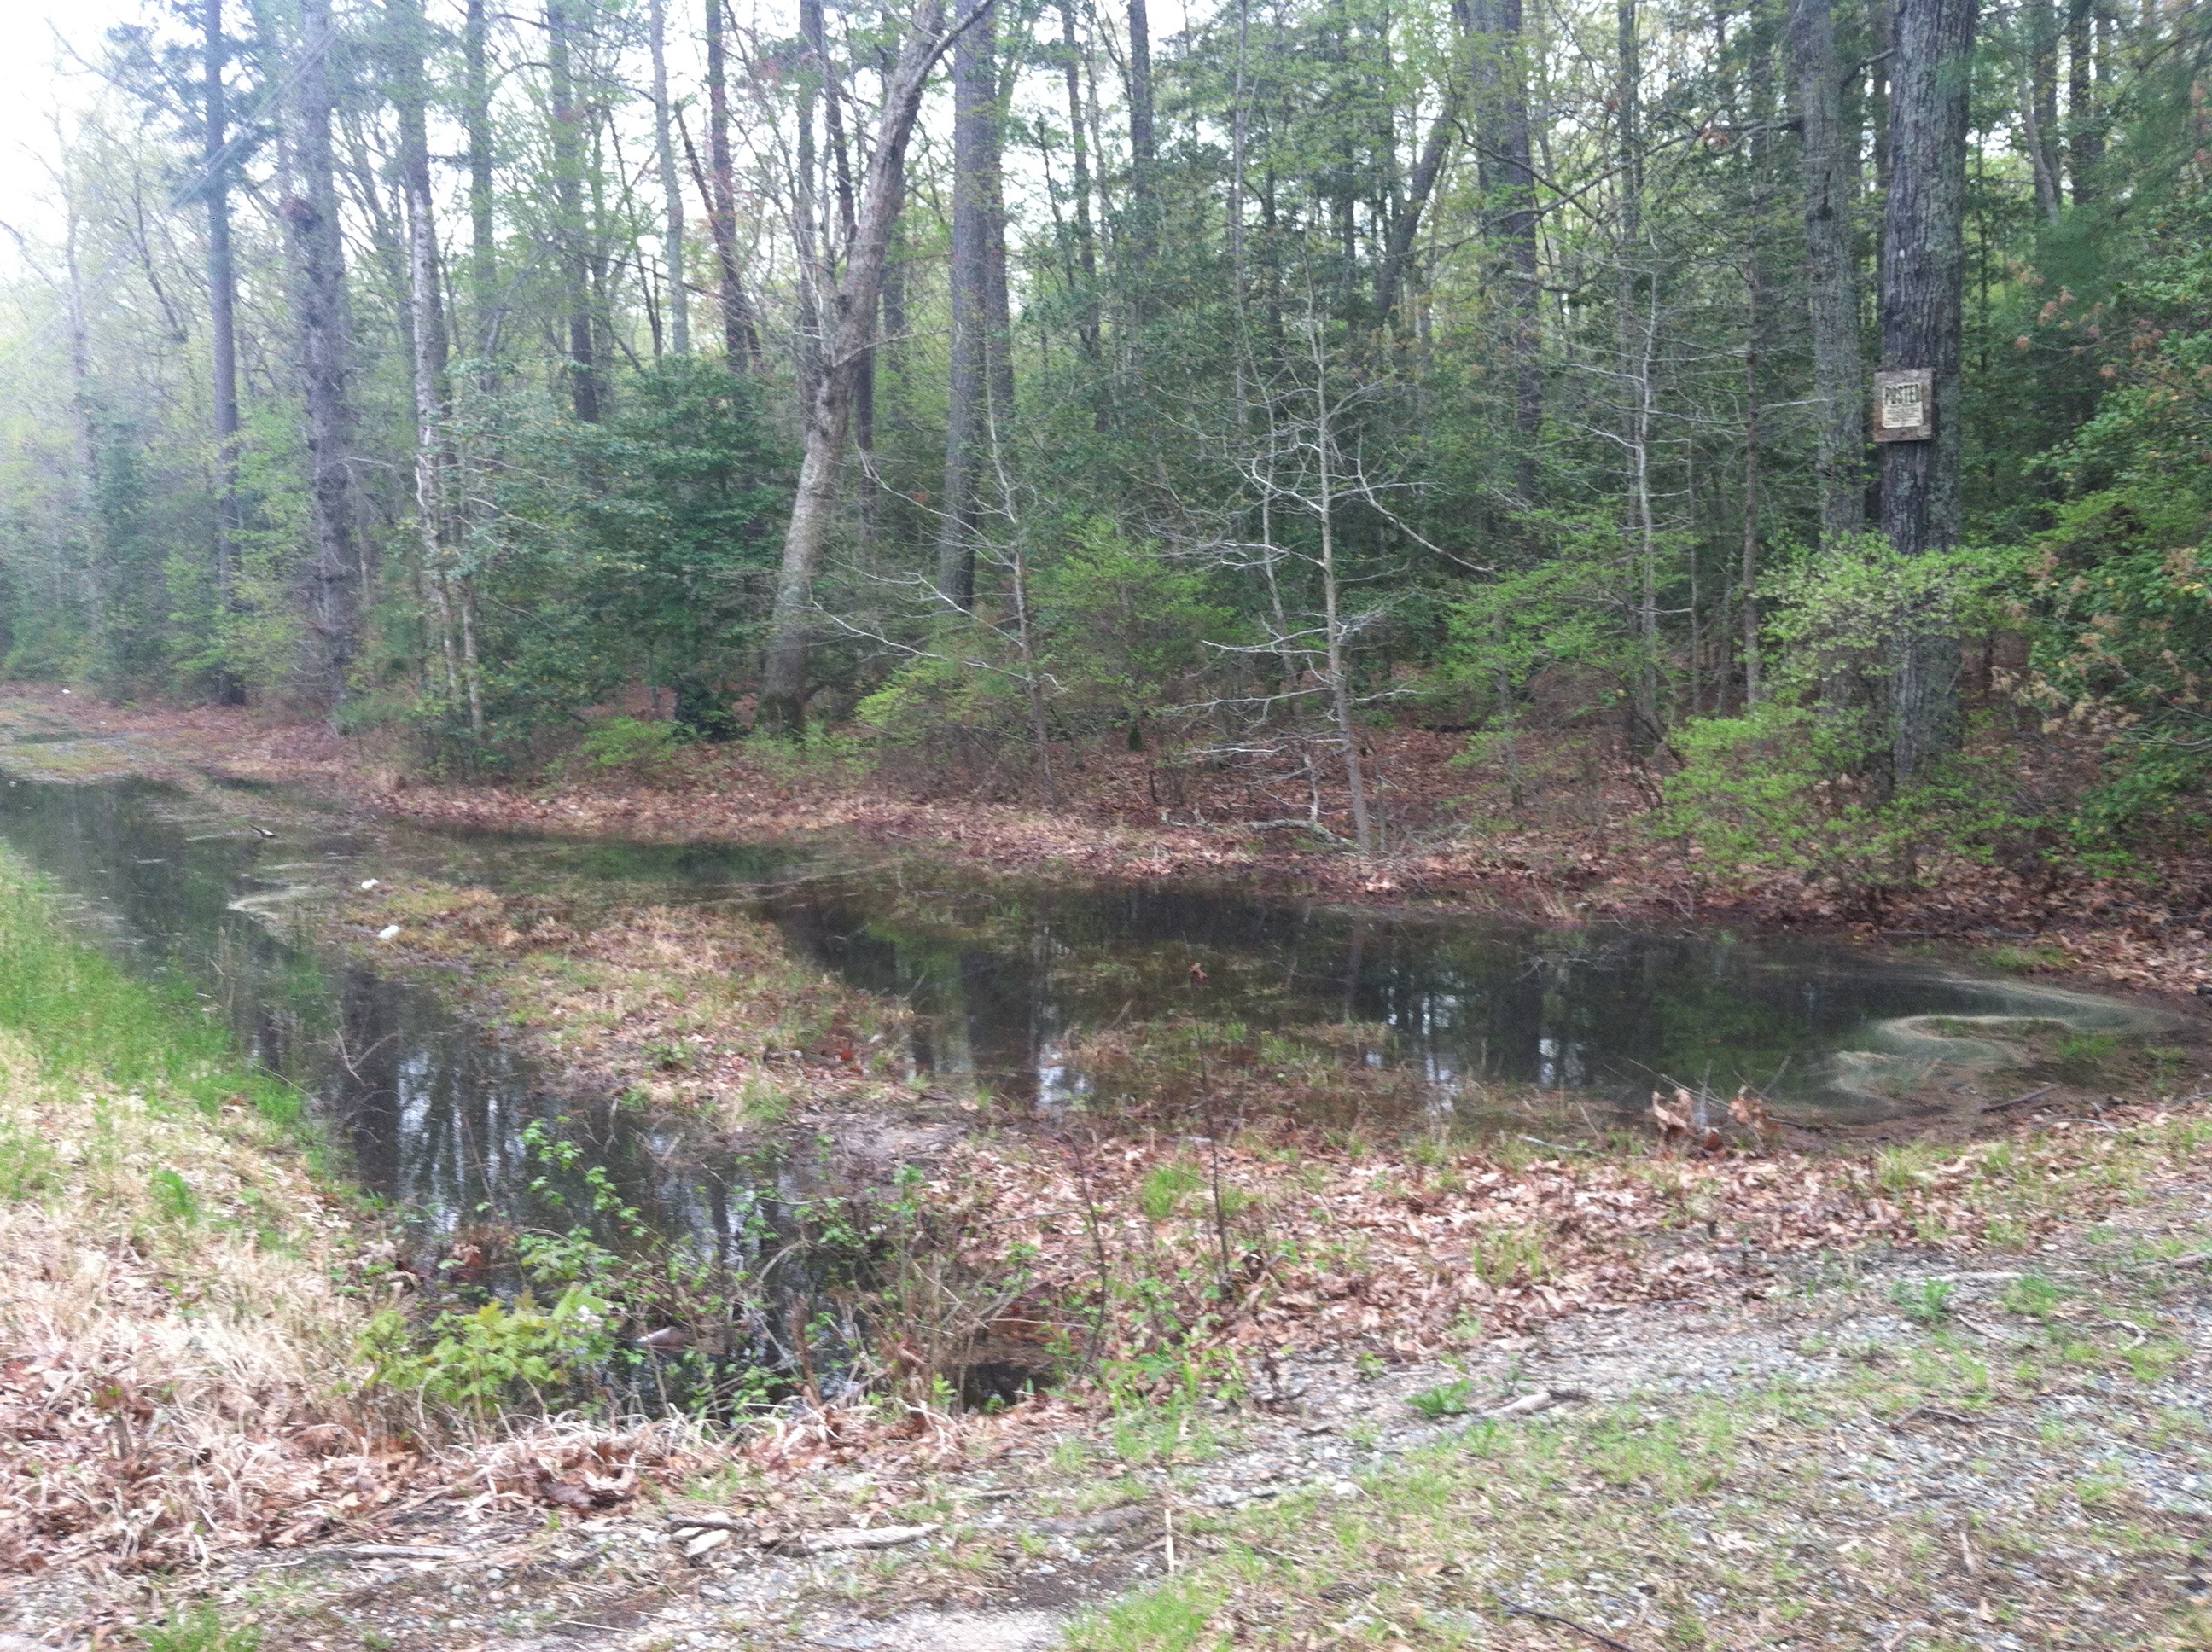
Blocked VDOT roadside ditch flooding adjacent land.
I wrote a report in 2012. If anyone in authority had paid attention then, we’d be seeing results now, instead of looking at more flooded ditches and damaged roads. Expect our TMDL numbers (total maximum daily load) for E. coli levels to stay the same, because the problem is not primarily land-based. It’s VDOT ditch based.
Although nothing about dissolved oxygen levels made it into the final EPA-accepted Water Quality Improvement Plan, there was a recommendation for a Ditch Task Force involving the Virginia Department of Transportation. The intent was to discuss and plan ways to improve the drainage for our state roads. Instead, we have the Middle Peninsula Planning District Commission advocating the creation of a Ditching Authority to charge landowners and counties for VDOT’s failures.
MPPDC is basing its Ditching Authority concept on states and countries which drained wetlands for agricultural purposes–and must continue to drain them to continue farming. Ohio, for example, drained 7.4 million acres of wetlands, and today, 2/3s of their cropland and 500,000 homes depend on that land staying drained. They have a Ditching Authority.
Our drainage problem is rainfall from state roads cannot reach receiving bodies of water because of failed and neglected VDOT maintenance. The cause is not wetland drainage, not agricultural land drainage, not private property drainage, not sea level rise, not land elevation or land subsidence.
Read the report and see for yourself if it makes sense.
Report for Working Groups for the Shellfish TMDL Implementation Plan for the Piankatank River, Gwynns Island and Milford Haven Watersheds, August 27, 2012
submitted by Carol J. Bova
A review of the original Shellfish Sanitation Surveys and outstanding violations for the Piankatank River, Gwynns Island and Milford Haven Watersheds doesn’t document enough ongoing septic system violations to account for the continuing high levels of bacteria in the TMDL waters. From the June 30th report, only Healy Creek had one prior uncorrected septic issue. There were two kitchen deficiencies: one at Healy Creek and one at Edwards Creek.
There are no large agricultural operations, fewer farms than decades ago when the waters were not impaired, and not enough hobby livestock to account for current bacterial impairments. It’s equally unlikely that pets are the main factor, and while wildlife contributes a significant amount, it is not the sole source.
Based on scientific findings over the last six years across the United States, in Canada and in Europe, naturalized E. coli is the most likely major source of the ongoing high bacterial readings.
These studies show E. coli does not require a human or animal host to survive for extended periods in soil, sand, sediments and water. Wind and storms stir up sand and sediment and release bacteria back into the water column. Bottom feeding fish like spot and croaker can take in E. coli while feeding and become carriers. Studies in Michigan show E. coli can survive 5 months in water as long as the temperature is above 39 degrees Fahrenheit. Average water temperatures for the TMDL areas only go below that in January and February and may not go that low in some years. E. coli doesn’t only survive on its own–it can reproduce if it has adequate carbon based nutrients. The presence of muck, which is partially decomposed vegetation, provides that nutrition and shelters E. coli, because no sunlight can get through it. It takes four days of sunlight to kill E. coli.
Part of the key to eliminating E. coli in the TMDL waters is to get the water clear enough to allow sunlight to penetrate. The plan to restore oysters is intended to do that, as well as filter the water, but oysters can’t live in the muck and must be suspended above it. The headwaters and some of the small inlets of the creeks are among the worst areas, with heavy muck, little circulation and probably low levels of dissolved oxygen in the water which must be addressed before oyster placement. Submerged aqueous vegetation will also benefit from more sunlight.
The long-term goal of restoring oysters is solid, but needs to be backed up with a multi-layered approach to cleaning up the waters, with a plan tailored to the characteristics of each TMDL segment. In Queens Creek, for example, at least 3-4 feet of muck exists on the sides of the channel, possibly more in the center. If the channel could be dredged to remove most of that muck, the creek could then be treated with probiotic decomposer bacteria to help break down what remains. This would create a more favorable environment for oysters and other water animals and allow sunlight to reach deeper into the water, killing even more E. coli.
Using small aeration units attached to private docks to provide additional oxygenation has been tried in Maryland. William Wolinski of Talbot County Maryland Dept. of Public Works stated the aeration used there from May through October created ‘oxygen sanctuaries’ for fish and other creatures and allowed positive bacterial action to break down sludgy sediment. A simple unit costs about $500-$600 and covers 1/4 acre placed at a 4′ depth according to one manufacturer. Any aeration provided will improve the action of probiotic bacteria in decomposing muck sediments.
Before any direct action is taken in TMDL creek headwaters and inlets, the Virginia Department of Transportation roadside ditches and related outfall ditches leading to those waters must be cleaned, pipe blockages cleared and overgrown vegetation removed to allow clean rainwater to reach the waterways. Currently, the water in outfall ditches is deoxygenated by decaying plant matter and has little to no flow except during storm events. Major storms flush the stagnant water into areas leading to the headwaters, and the load of rotting vegetation and silt with it adds to the mucky sediment already present.
The Virginia Department of Transportation should be named a stakeholder in the TMDL Implementation Plan for low dissolved oxygen levels in water in ditches which connect to TMDL waters. Credit trading should not be an option because the actions required to improve oxygenation fall within normal roadside maintenance and budget. DCR and DEQ staff can support citizen requests for a VDOT 5-year plan for roadside and outfall ditch maintenance to provide an outlet to an adequate receiving channel and body of water as required by VDOT Drainage Manual policies. This will allow clean, oxygenated rainwater to reach TMDL waters, giving other measures a better chance of success.


