How Hole in the Wall Became Hole in the Wallet

By Carol J. Bova

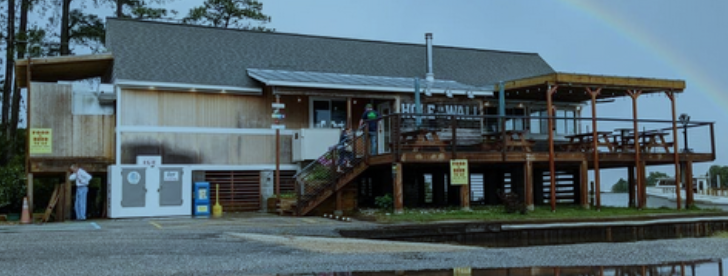
After the septic system of the former Seabreeze Restaurant failed in June 2016, the Board of Supervisors voted to postpone signing a new lease with the Hole in the Wall Waterfront Grill until repairs on the failed 1998 system were completed. Former county officials and the local health department influenced the Board of Supervisors to sign the lease in December 2016, but the septic repairs were not completed until a year later.

The county owns the .927-acre parcel which has a public boat ramp in addition to the restaurant. At less than one acre, it is too small to subdivide. Twice in 2017, in 2019, and again last year, the issue of selling surplus land, including this site, was raised and died in Board of Supervisors meetings. If the land were sold, there would be no way to guarantee the boat ramp would remain public.

As of March this year, the County has paid over $127,000 in septic pump and haul bills for Hole in the Wall Waterfront Grill. Many now recognize the Board should never have agreed to the lease until the septic system issues were resolved. Board minutes and FOIA requests eventually filled in the backstory of how former Mathews County Administrator, Mindy Conner, and former Building Official, Jamie Wilks misled the Board.

This was not the first time Conner acted against the County’s best interest. Conner and two other former county employees are involved in a lawsuit filed by Mark Eubank that went all the way to the Virginia Supreme Court. The details were in “A Malicious Prosecution” published in Bacon’s Rebellion in September 2021. The case was sent back to the lower court and is scheduled to be heard later this year.

On September 27, 2016, Wilks told the Board that the issues with the restaurant’s septic system were in the process of being resolved, and repairs would begin after an inspection in the coming week. Although the lease was still being negotiated, Wilks reported he had already given Mac Casale a permit to begin interior demolition of the former Seabreeze Restaurant. The Board voted to delay signing the lease until the septic repairs were complete.

On October 25, Wilks told the board he had received a preliminary report from the septic contractor, soil scientist and septic engineer, and he had to work with the Health Department on their recommendations. He said the Health Department already told him they would approve the repairs, and the process was “just the technicalities.” He did not inform the board that the scientists had no viable solution to return the system to normal function.

At the November board meeting, Conner said, “We have a path to getting the approval…an agreement on the scope of work they want us to do.” She urged the supervisors to go ahead and authorize her to execute the lease on their behalf because it wouldn’t take effect until the Health Department approved the septic system for use. The board gave her the authorization, and the lease was signed on December 1.

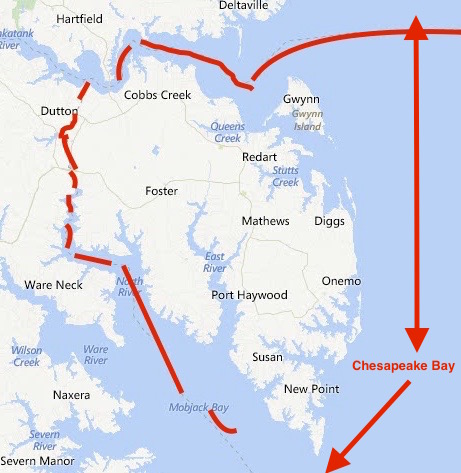
The supervisors were still not told the October inspection by the septic system experts showed the septic system was discharging into the groundwater which was at the depth of the drainfield chambers. (The drainfield is under the parking lot.) There is also no record that the board knew the local health department representative, Patricia Duttry, had written an email to Conner and Wilks on November 7 saying “Because of the shallow seasonal water table and depth of the drainlines, the design would have to meet the Regulations for Alternative Onsite Systems related to direct disposal to ground water.” She offered to support a variance from the required treatment levels which could only be granted by the State Health Commissioner.

It is a mystery why Duttry would go along with direct discharge at a waterfront location at Milford Haven which connects to the Chesapeake Bay instead of saying she would have to pull the septic system operating permit if the county could not meet the health department’s septic system standards.

On December 5, 2016, Wilks confirmed to Duttry the septic system drainlines were not damaged or blocked and asked to begin repairs immediately. He added, “We would include the missing items that were never installed.” In spite of FOIA requests, the last line of this email has never been explained: What items for the septic system had been missing from the original 1998 installation?

On December 7, Duttry told Conner and Wilks they could still use the 1998 septic permit “for 45 seats/380 gallons per day (and using a 1000 gallon Multi-flo unit for treatment to reduce biological oxygen demand and total suspended solids) so there would be no room for expansion.”

The septic contractor wrote to Conner and Wilks on January 7, 2017 and included the findings and recommendations from the October inspections and testing. The soil scientist’s report said, “The three drainlines are completely in the water table. It is amazing it has worked as long as it has….I really have no viable solution for repair.” He then discussed creating an elevated mound which would eliminate the parking lot, or consider trying to obtain a permit for direct discharge into the ground water. (Note that Duttry was already aware of this recommendation the previous month.) The soil scientist also said, “Maybe the permanent pump and haul is the best option, but this will be costly, especially during peak season.” He noted, “Health Department Regulations generally prohibit permanent pump & haul.”

This information was not shared with the supervisors, and Conner hired two companies to do work on the system, then chose one to complete all the repairs. The company submitted a report to the health department at the end of December 2017 that with the maintenance and repairs that were done, the system should return to normal function. It turned out that even more work was needed, and again in May 2018, a second report to the Health Department repeated that the system was functioning as designed.

As part of the lease, the tenant was to raise the building out of the floodplain.

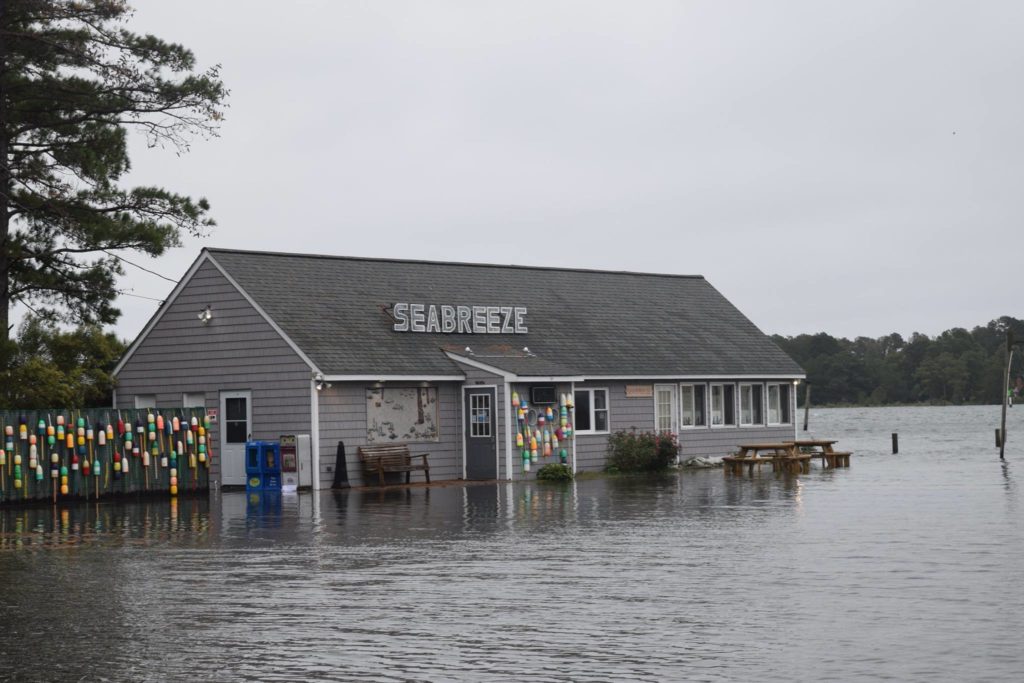
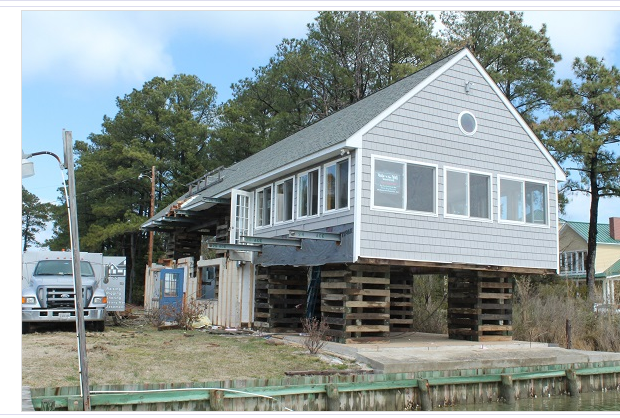
HITW raised off the ground

The restaurant opened in July 2019, but a year later, Duttry told the Mathews Gloucester Gazette Journal about more problems. “The high water table is one of those problems, she said, but the issue that has been causing eruptions of effluent onto the ground has to do with the aeration and filtration systems in the engineered septic system. There seems to be an excessive buildup of fats, oils and greases in the aeration tanks, she said, and thus far no one has been able to pinpoint the cause.”

Imagine that. A buildup of fats, oils and greases in a restaurant septic system, and no one could pinpoint the cause.

Because of the sewage eruptions through potholes in the parking lot, the county arranged for pump and haul of the waste beginning in July 2019.

Casale worked with former county administrator Mindy Conner to solicit a proposal for an ozone disinfection system from NextGen Septic Solutions in Ohio to be used with the existing Multi-Flo septic system. In November 2019, Casale corresponded with Pat Duttry and David Fridley from the Virginia Health Department (VDH) on how to get approval to install the system which was not approved for use in Virginia. He was told to arrange a preliminary engineering conference to review the proposal and that final plans would need to be prepared by a Professional Engineer licensed in Virginia. A copy of the VDH reply was sent to Conner.

Almost a year later, on September 1, 2020, NextGen sent Conner their technical proposal. The Board of Supervisors wasn’t officially informed of the proposal until their September 22, 2020 meeting packet was distributed. Although the board voted “to authorize staff to move forward with the pilot program as offered by the Health Department,” the next day, Casale sent the proposal to VDH.

Ten months later, according to Board minutes, Conner told the Board on May 24, 2021, the permit fee was “between $200 and $250 for the Hole in the Wall septic repair. She noted that the proposed system would be a NextGen system.”

Four days later, May 28, 2021, without using public purchase policy and without a bid process, without a formal contract or board approval of the original invoice, Conner approved the first payment of $50,000. The invoice of $72,800 did not include shipping, site preparation, on-site installation, taxes and permit fees. The check dated July1, 2021 was voided and reissued on July 27, 2021 under the ARPA account as a capital outlay. There was no record posted to the board or public until the August 23, 2021 meeting packet.

On July 23, 2021, a week before she retired for medical reasons, Conner wrote, “Accepted by Melinda Conner 7/23/21” on a NextGen Scope of Work with no amounts shown.

On November 5, 2021, interim county administrator Sandy Wanner approved a second payment of $18,000.

The county received a third NextGen invoice dated January 28, 2022 to upgrade the system to 544 gallons per day at a cost of $128,900 with $60,900 still due, plus all the additional charges for shipping and installation.

It should be noted Duttry’s 2016 statement was that the VDH septic system permit did not allow for any expansion, and that the lease on page 8 said capital improvements were the responsibility of the tenant.

In regard to the last point, Casale provided NextGen an inaccurate sewage usage number of 384 gallons per day (gpd). (The street number is 384, 380 gpd is the permit amount.) The NextGen proposal addressed to Casale said, “It is assumed that all of the above treatment units are working, as designed.” But they were not, and the site was on pump and haul because of effluent eruptions onto the ground. The system was certified to the health department as functioning in May 2018 before the lease began on June 1, 2018.

No new design or engineering report was submitted to VDH showing the system could meet the current standards, not the 1998 standards the restaurant permit used. But even the proposed  new upgraded system’s maximum capacity of 544 gallons a day will not resolve the problem because the restaurant water meter readings show they used more than that daily average for every day in both July and August 2022, and that does not consider melted ice and other discarded liquids.

The NextGen proposal states the air temperature requirements are 32 to 95 degrees F and the dryer unit for the ozone generator is used up to 75% relative humidity. This makes its use as an outdoor system questionable for Gwynn’s Island. The site cannot support a new drainfield that can handle the Hole in the Wall Grill’s volume of effluent, so that rules out a number of other options.

The pumping expenses are over $127,000 from July 2019 through March 8, 2023. The daily average of water meter readings generally ran between 500 and 833 gallons in the warm weather season from July 1, 2022 through September 19, 2022. Only two weeks showed an average per day at or below the permitted 380 gallons a day going to the septic system. (These averages include days when the restaurant was closed.)

Adding the pumping cost and the amounts paid to NextGen adds up to just over $195,000. Paid by taxpayers  Now, the Board of Supervisors will hold a public hearing March 28 to see what taxpayers think about spending another $307,000 to correct the problems caused by the tenants’ raising of the building and improper foundation work that created a safety issue. (See Unsafe Structure Notice including lease and structural engineeer’s report here for details.)

If the County repairs the building, the total from taxpayers would be over half a million dollars. All because former county staff did not disclose facts that would have prevented the Board from going ahead with the lease, a tenant who would not abide by the VDH permit limitations, and the failure of the former building official to properly inspect the construction involved in raising the restaurant.

No other business in the county receives a subsidy from taxpayers for their business expenses. This one shouldn’t either.

Update: At the March 28 Board meeting, the county administrator provided a Powerpoint presentation with a timeline of events and the options, along with the budget impacts. Click here for that slide show.

Woke Geology from the Washington Post

By Carol J. Bova

The Washington Post published a piece June 4, 2021, on the geologic origins of Mid-Atlantic summer destinations, many in Virginia. Its wrap-up switches into Woke doctrine and describes the Chesapeake Bay as “a case study in climate change…Efforts are on to mitigate the effects of rising water on islands in the bay and the cities and towns along it.” The article warns, “Climate change may have brought the bay into being, but now human-caused climate change endangers it… will the Chesapeake Bay itself cease to exist, subsumed by the Atlantic?”

Dramatic. Of course, there was no place for mention of the impact crater that provided the depression in which the Bay formed. The article refers to the melting glaciers of 10,000 years ago. No mention, though, that during each of the five Ice Ages going back to 2.4-2.1 billion years ago, glacial periods have always been followed by interglacial periods when the temperatures rise, or that we’re still in one.

Of course no mention of the land subsidence from the excessive drawdown of water in the Potomac and related aquifers by Virginia, D.C., Maryland, Delaware, and New Jersey. And certainly no mention of the role of that subsidence in relative sea-level rise in the Chesapeake Bay region, especially in Hampton Roads.

Instead of those inconvenient details, it was much easier to rely on the mantra of “human-caused climate change.”

Rowe Didn’t Do His Homework on His Hole in the Wall Septic System Solution

By Carol J. Bova

In his interview for the interim board position, when asked what do you think a board member should do to be effective, Mike Rowe said, “Do their homework.”

He did not do his homework on the solution he claimed for the Hole in the Wall Restaurant septic system at the Board of Supervisors meeting on September 24th. He didn’t give the board any documents or facts to support what he said, and most of his statements were incorrect.

He did not discuss how a direct discharge of treated wastewater fits the Milford Haven TMDL (Total Maximum Daily Load) from the EPA-approved water quality improvement plan or the impact to the oyster grounds and recreation adjacent to the restaurant. Even well-treated septic system effluent discharge will cause a permanent condemnation of that part of Milford Haven for shellfishing. Do we really want to discharge treated sewage effluent where people boat, kayak and use paddleboards?

Rowe, along with supervisor Amy Dubois, the county administrator, the building official, and the restaurant owner, had a private meeting with a vendor, Environmental Services of Virginia, who “gave an assessment of what he thought could be done.” The vendor “recommended an alternative system, which would be the Clearstream, and he recommended that we apply for a permit with DEQ, and once we get that, then they can design the system.”

Rowe said that without a DEQ permit you can’t move forward, but he didn’t say DEQ cannot approve a discharge permit alone. They must forward an applications for discharge into shellfish areas to the Virginia Department of Health Environmental Health Services division (VDH-EHS.)

Dr. Marcia Degen from VDH-EHS said, “There is no general approval process and the design is reviewed based on the information submitted by the design engineer.” The designer must show the selected unit can perform as required to reduce pollution and suspended solids. So an engineered design is required before the permit application is submitted.

Asked about the price for the system, which would include UV disinfection, Mr. Rowe said, “Total price tag, engineering and installation will be between $23,000 and $30,000 dollars.” He also said there is no fee for that permit from DEQ. Rowe’s cost estimate is too low, perhaps half of what would be required.

The current operating permit was issued in 1998 and allows 380 gallons of wastewater a day for 45 seats. The current Virginia Health Department (VDH) standard is  2,250 gallons a day (gpd), based on 50 gpd for each seat. (12VAC5-610 in Table 5)

The largest Clearstream treatment system is 1500 gpd. So two systems that can handle a capacity of at least 2,250 gpd are needed, including pretreatment and a UV disinfection treatment for each.

DEQ VPDES (Virginia Pollutant Discharge Elimination System) Permits are not free for commercial systems. Hole in the Wall, with  821,250  gallons per year, would fall under the category of Industrial Minor (less than 1 million gallons per year) with a new permit fee of $3,300. (9VAC25-20-110. Fee Schedule).

Rowe didn’t follow the County’s Small Purchase Policy either. Since two Clearstream units, engineering, design, permits and installation will exceed the original $30,000 estimate, County Procurement Procedures for $30,001 – $50,000 require informal solicitation of a minimum of four bidders or offerors, and an award must be made in writing. He did not mention any other bidders, nor did he present a contract for consideration by the Board before he requested approval to apply for a permit. The County Administrator also failed to mention the purchase policy requirements.

This is how the County gets tangled in difficult and costly situations – Not enough facts, not enough research, and inadequate follow through by staff.

Written and Authorized by Carol J. Bova

More to Mathews Than Tourism — A Bit of Fishing History

By Carol J. Bova

A recent Facebook post from Mathews fell into the “damned if you do, damned if you don’t” category. It showed an area on Lane’s Creek displaying the markers required by the Code of Virginia 4 VAC20-290-30 to safeguard boat navigation. The comment was, “Hard to imagine how views like this will become ‘tourist attractions’!!!” What the poster overlooked, is the reason for the signs–not the safety aspect, but why they are there at all. It’s for business, not recreation, and tourism is not the focus.

This signage isn’t impairing the view of the New Point Comfort Lighthouse, or interfering with the function of the Bethel Beach Nature Preserve, or preventing kayakers from launching at New Point or Put-In Creek. In spite of the County Administrator’s emphasis on tourism, and the Planning Commission’s misleading statistics in the comprehensive plan, there is more to the economy of Mathews County than visitors to our county.

Long before tourism became a national pastime, the water provided Mathews with transportation, food and income. The National Park Service describes fishing by Native Americans in the 1580s:

For the most part, the Indians caught their fish in net-like obstructions called weirs, which they placed across streams or channels in much the same way as modern pound-netters catch the seasonal runs of striped bass or shad. The weirs were made of reeds, woven or tied together, and anchored to the bottom by poles stuck into the sand. With their tops extending above the surface of the water the weirs looked very much like fences, and were arranged in varied patterns designed to catch the fish, and then impound them.

Watermen in 1904 used 242 pound nets worth $54,150 ($1.49 million in today’s dollars), 1,101 boats and 505 oyster tongs.

Pound nets are a series of nets anchored to the bottom perpendicular to shore and are set in nearshore areas. Courtesy of NOAA Fisheries.

While tourists do bring in income through retail purchases and sales tax, meals and meals tax and the lodging tax, water-related businesses bring in annual income on real estate they own, business tax on their earnings, machine and tools tax on their equipment, and business tangible personal property tax on boats and vehicles.

Times have changed since 1904, but that shouldn’t mean preventing the sight of working businesses on the water that help support the County year-round. If the crabbing and oyster industries had never declined, and those activities had remained highly visible, it wouldn’t have eliminated tourism. Businesses change to meet the times, and a change in aquaculture now isn’t going to end tourism in Mathews.

Fiction’s More Dramatic Than Facts When It Comes to Oysters

by Carol J. Bova

In my June 14 post, I talked about the benefits of floating cage oyster aquaculture for improving water quality. So I’ve been quite surprised at the comments objecting to Kevin Wade’s Milford Haven application to the Virginia Marine Resources Commission (VMRC). I considered each protest and found many were based on misinformation or lack of information.

Eighty-three couples or individuals filed 98 protests to the application, with 295 separate statements. I sorted those into five general groups: Business, Water Access and Safety, Environmental, Miscellaneous and Personal Impact. The first four involve factual matters and opinions about those matters. Those in the Personal Impact group are about perceptions and feelings, and I’ll discuss those in a separate post.

Business: 100 objections

Twenty-four of those were opposed to commercial development in Gwynn’s Island, some against all commercial development there. This is not only unrealistic, particularly for a working waterfront district, VMRC has no jurisdiction over this.

The other 76 objections were related to the land operations of this specific business: 28 for increased traffic, 26 for noise, 13 for smell, and 9 miscellaneous for trash, increased septic demand, hours of operation, being in the RPA, “surrounding neighbors and waterfront,” and the belief jobs will be seasonal and they won’t employ locals.

Noise, Trash, Odor:

This company has operated for 18 years at this location without problems, and some of the facilities there go back to the 1950s. If the application is approved, the natural movement of the water on the floating cages will eliminate the need for tumbling equipment. Flipping the cages periodically in the water eliminates the fouling that requires power washing. Sorting and packing will be done indoors.

If the floating cage application is turned down, tumbling and power washing will be necessary.

Traffic:

Previous business in crabs was at least twice as much as there will be even with the new aquaculture project. While heavy trucks were used to ship crabs in the 1950s, none are required for the current business or future oyster project. Since the oysters will supply the half-shell market, shipments can go out on small refrigerated trucks that will not burden the infrastructure.

Jobs & Septic Demand:

The 14-16 new full-time, year-round jobs will be open to any locals who wish to apply, at above minimum wage. Since there used to be twice as many people working there in the past, there is no issue with septic system capability.

Water Access and Safety Issues: 56 objections

These protests were on impacts to navigation, water access from private docks, safety issues and increased boat traffic.

Increased Boat Traffic:

Tending the oyster cages will be done from two boats working 6 a.m. to 2 p.m. Not exactly a marine rush hour situation.

Navigation, Access, Safety:

All of the other issues are covered by VMRC General Permit 4 and the Joint Permit Application for the project. The agencies reviewing the application are the Virginia Department of Environmental Quality (DEQ), VMRC, U.S. Army Corps of Engineers, and local Wetlands Board. The application shows:
– No riparian landowners are within 500 feet of the area in the application.
– Only 5.5 acres of the current 18.03 acre ground lease will be used.
– No dock or other access to the water from the shore will be impeded.
– No navigation channel will be impacted.
– Boundary markings will be according to state regulations.

Environmental: 42 objections

Some of these objections are the hardest to understand. Can so many people really not know what oysters do for the environment?

Pollution:

Oysters do not pollute water or cause excess sedimentation. Oysters improve water quality by filtering phytoplankton, excess nutrients and sediment from the water. When they are harvested, the nitrogen they took into their bodies and shells are permanently removed from the water. The U.S. Department of Agriculture has recognized shellfish gardening and farming “for the positive impact it has on the Chesapeake Bay.”

Impact on Eelgrass:

Eelgrass is one form of subaqueous vegetation (SAV). The map below from VIMS shows areas of SAV beds in Milford Haven. The proposed floating cage project will not be over SAV, so it cannot shade it, but when the oysters filter the water and improve the clarity, more sunlight will reach the SAV, which in turn, allows it to produce more oxygen and provide all the benefits the protestors were concerned about.

Image courtesy of VIMS SAV Ecology, Monitoring & Restoration Program, College of William & Mary.

One person quoted from what he said was a study from the University of Massachusetts about aquaculture ecosystem damage from oyster cages that destroyed eelgrass, which in turn,has impacts on migratory waterfowl. He called for an environmental impact study, but what he quoted from was not a study, it was a blog post by UMass students about an Audubon Society lawsuit against Humboldt County in California over allowing an expansion of oyster aquaculture in and over SAV beds. All the citations in that blog post were related to those problems or discussed the functions of SAV. There was no connection to the conditions specified in the local application.

Ospreys:

Concerns that the cages will interfere with ospreys looking for fish are unfounded. Ospreys hunt from the air and clearer water will help them locate fish more easily.

Miscellaneous: 23 objections

Five gave no reason.

Four said it would interfere with potential archeological surveys, although VMRC General Permit #4 requires permittees “to cooperate with agencies of the Commonwealth in the recovery of archeological remains if deemed necessary.”

Three felt there’d be a negative impact on tourism, even though Kevin Wade wrote in a letter to the editor of the Gazette Journal, “We’ll add to the eco-tourism goals of Mathews County, showing the waterman’s lifestyle, even though it’s a slightly different form, and the benefits of aquaculture as a sustainable model.”

The remaining eleven objections felt Gwynn’s Island was an historic district and the project did not belong there. In 1895, however, in the Report of the Chief Engineer of the Army to Congress, Major C.E.L.B. Davis reported about Gwynn’s Island: “It has a population of 600 to 700, chiefly engaged in fishing and oystering.” The location has been a working waterfront for over 200 years. What on Gwynn’s Island is more a part of its history than that?

So far, facts have not made a difference in the attitudes of those protesting this project, but the facts are spelled out here.

Personal Impact

I will discuss this group of 74 objections related to property value, view, and quality of life in the next post on InsideTheCrater.com.

Oysters and Cleaner Water

By Carol J. Bova

When I learned of the Island Seafood oyster aquaculture project application to the Virginia Marine Resources Commission, I realized this will be the first significant progress toward our water quality improvement goals for the area. In 2012-2013, I was one of four citizens on the Steering Committee of the Water Quality Implementation Plan for Gwynns Island, Milford Haven and Piankatank River Watersheds.

Floating Cage Oyster Aquaculture

History
We struggled to get the state agencies to adjust the numbers of people and animals they used to calculate water quality goals to more accurate levels, but also to go beyond blaming septic systems for the areas with E. coli. The Department of Conservation and Recreation (DCR) was the lead agency, and they did make a number of adjustments in the numbers of people, dogs, wildlife and farm animals based on citizen research.

Same Problems Still Exist
We were unable, though, to convince the authorities that we couldn’t expect to reduce the E. coli numbers until the Department of Transportation road drainage system allowed oxygenated water from fresh rainfalls to reach the major creeks and rivers. Six years later, headwaters and other streams still cannot flow through blocked pipes under roads, and stormwater still accumulates in roadside ditches, losing oxygen and growing cyanobacteria. While not monitored by the Virginia Health Department, cyanobacteria can produce toxins, and VIMS did find a low level of toxic microcystins in a sample from ditch water pictured below:

Oscillatoria (cyanobacteria) Identified in Mathews by VIMS.

E. coli Can Survive Without Oxygen if Protected From Sunlight
When E. coli encounters waters without sufficient oxygen, It enters a viable, but non-culturable state. This means while its predators, in the form of beneficial bacteria, die off without oxygen, E. coli stops reproducing and settles into bottom sediments where it’s protected from sunlight. When storms stir up the waters, and oxygen does reach the E. coli, it once more begins reproducing, without any new input from humans or animals.

Commonwealth Not Ready for Novel Ideas Then
Our 2012 suggestion to provide aeration and probiotics to the headwaters of contaminated larger streams was rejected by the Health Department staff on the committee. They refused to believe E. coli could survive in sediment beyond a few days. Journal references from researchers around the world did not convince them.

In 2015, news accounts of an experiment at Annapolis showed using aeration and probiotic bacteria did reduce E. coli levels by reducing mucky sediments, improving oxygen levels, and restoring beneficial bacteria. (Chesapeake Style, pg. 37). To my knowledge, no one in Virginia has followed this idea. Nothing has improved the E. coli levels here to any measurable extent.

Hope at Last
Now, with the Milford Haven oyster aquaculture project, in spite of the VDOT drainage failures, we have a new way to improve the water quality. We can look forward to improvement in the E. coli numbers as oysters filter millions of gallons of water and remove sediment and excess nutrients from the upper water column. Nearby subaqueous vegetation will benefit from more sunlight reaching the beds and add more oxygen to the Bay’s waters as they grow. So as a result of a waterfront business operation, we end up with cleaner water, less E. coli, more SAV and more oxygen in the water–at no expense to the County or Commonwealth.

The Mayor of Tangier Island is Right

By Carol J. Bova

(Originally posted as a response to James A. Bacon’s blog, “Does “Ooker” Estridge Know Something the Experts Don’t” on Bacon’s Rebellion about sea level rise impacting Tangier Island in the Chesapeake Bay. Tangier Island is losing about 16 feet a year on its western side and 3 on the eastern.)

“Ooker” Estridge is right that Tangier Island’s problem is erosion, and he’s got hard science behind that statement. While sea level rise is a long-term issue and increased monitoring of local impacts is important, that’s not why Tangier Island is endangered. Lewisetta is the nearest tide gauge and not out in the Bay, but the local sea level trend is 1.7 ft in 100 years, which is less than a quarter inch per year. So there’s more in play there.

“Storms provide the greatest source of coastal change on barrier islands due to storm surge and strong waves. Surging water and stronger waves can erode barrier island beaches and, if the surge is high enough, result in overwash, breaching, or back bay flooding… .” (U S Army Corps of Engineers, North Atlantic Coast Comprehensive Study: Resilient Adaptation to Increasing Risk. January 2015.)

Tangier Island is a barrier island, and like all barrier islands and barrier beaches, it’s made up of sand-sized sediment that is deposited, moved, and reformed by wind and waves. Political positions about sea level rise have ignored the reality of longshore transport of sediment (also called longshore drift). If the sand supply is not maintained, the island erodes to the point where it is inundated by the tides. No one realized in the 1700s how fragile these bodies are, or that it wasn’t a good idea to build on them.

NOAA relates the story of Tucker Island in New Jersey, settled in 1735, and how attempts to stop longshore transport of sand using jetties in 1924 eventually caused the loss of that barrier island.

We have the same problem on the Chesapeake Bay coastline in Mathews County where we’ve just about lost Rigby Island, another barrier island, and have a breach in the Winter Harbor barrier beach caused by a nor’easter in 1978.  Beach replenishment could repair it and restore the protective function of the barrier beach against storm surge flooding, but the Virginia Institute of Marine Science and the Corps of Engineers chose instead to only supplement the tiger beetle habitat below the breach, allowing the breach to continue to widen.

The Virginia Department of Transportation helped create the problem by removing 5-7 feet of sand from the beaches to the north of Winter Harbor in the 1930s and 1940s to use to build roads in two counties. (This was confirmed by a memo in VDOT’s files.)

The Corps of Engineers also helped create the problem by working with the County to open a channel directly from Garden Creek to the Bay. The jetties they built to keep the channel open failed, but they also prevented the movement of sand southward to the Winter Harbor barrier beach leading to its breach.

Wetlands Watch joined with the Middle Peninsula Planning District Commission (MPPDC) in blaming sea level rise for the loss of the barrier beach and barrier island around the New Point Comfort Lighthouse in the NOAA grant-funded MPPDC Climate Change Adaptation Phase 2 report and repeated the claim in the 2011 Phase 3 report with slides implying sea level rise causes the lighthouse to be left on a tiny island. One has picture of the lighthouse in 1885 and “today” with the caption, “shoreline has moved 1/2 mile.” Another says, “TODAY – 5 ft water covers more than 1,000 plated subdivision lots.”


The platted subdivision only existed on paper because the project failed financially in 1905. Much of the barrier island and barrier beach were lost in the 1933 August and September hurricanes, and the rest lost through longshore transport after that.

The reports include those slides and a mocking cartoon about the “Coconut Telegraph,” alluding to person-to-person communication between Mathews citizens, as part of Power Point presentations made throughout Virginia and in other areas on sea level rise by MPPDC Executive Director, Lewie Lawrence.


When local observations are ignored in favor of political positions, everyone loses. Tax money is spent on the wrong responses and real problems get worse because they’re not acknowledged.

People who come from generations who’ve lived in the same place may not have the university degrees, but they have knowledge that could benefit the universities and government agencies who disregard them.

In the http://www.nad.usace.army.mil/Portals/40/docs/NACCS/NACCS_main_report.pdf”Hurricane Sandy report, the Corps of Engineers places barrier island and barrier beach preservation among the highest Coastal Storm Risk Management and Resilience measures, short of removing buildings from the coast.


Too bad no one considered this kind of replenishment for Tangier Island while there was a better chance of saving it.


The National Watershed Boundary Dataset – Chesapeake Bay Watersheds and Virginia River Basins

By  Carol J Bova

In 2001, the National Watershed Boundary Dataset (NWBD) became the official hydrologic unit system of the United States. Virginia made some adjustments to simplify identifying smaller watershed units. You might never need the details here, but if you do, this should help because an accurate list is not always easy to locate. A special thank you to Sam Austin and Randy McFarland of the USGS for their help.

Watershed Hydrologic Unit Code (HUC) Level, Name and Unit Size

1st Order = Region            HUC = 2 digits         Avg. 177,560 sq. miles

2nd Order = Subregion      HUC = 4 digits         Avg. 16,800 sq. miles

3rd Order = Basin              HUC = 6 digits         Avg. 10,596 sq. miles

4th Order = Subbasin         HUC = 8 digits         Avg. 703 sq. miles

5th Order = Watershed       HUC = 10 digits       40,000 – 250,000 acres

6th Order = Subwatershed   HUC = 12 digits     10,000 – 40,000 acres

The Virginia Department of Conservation and Recreation (DCR) describes River Basins as follows:  Although 3rd level units of the WBD are called “Basins,” these units are not necessarily the equivalent of river basins as described in many state programs. For instance, DCR frequently divides the commonwealth into 14 River Basins for program usage as follows: Potomac River, Rappahannock River, York River, James River, Atlantic Ocean Coastal, Chesapeake Bay Coastal, Chowan River, Albemarle Sound Coastal, Roanoke River, Yadkin River, New River, Clinch-Powell Rivers, Holston River and Big Sandy River. Except for offshore ocean claims, all of Virginia is accounted for in these basins.

Virginia developed a new four-character code for its 5th and 6th level units. The first two characters are based on the major stream name in the basin, or portion of the basin, where the unit is located. The two digits that follow are numbered in sequence by drainage flow from headwaters to mouth.

These four-character identifiers are not part of the national WBD standard. The Virginia system is called the Virginia National Watershed Boundary Dataset (VaNWBD). Originally released in 2006, the VaNWBD has been updated a number of times, and currently is referred to as version 5 (VaNWBDv5).

The Department of Conservation and Recreation (DCR) website lists the internal coding for all 5th and 6th level units of the VaNWBDv5 at http://www.dcr.virginia.gov/soil-and-water/hu. The Virginia coding for 5th and 6th level units for the Chesapeake Bay watersheds and sub-watersheds of the VaNWBDv5 from Table 4 shown below.

CHESAPEAKE BAY VIRGINIA WATERSHEDS AND SUB-WATERSHEDS
5th LEVEL UNITS (VAHU5) 6th LEVEL UNITS (VAHU6) DRAINAGE
PL-A – PL-U PL01-PL74 Potomac River, Lower
PU-A – PU-F PU01-PU22 Potomac River, Upper
PS-A – PS-T PS01-PS87 Potomac River-Shenandoah River
CB-A – CB-O CB01-CB47 Chesapeake Bay/Chesapeake Bay Coastal
AO-A – AO-H AO01-AO26 Atlantic Ocean Coastal
RA-A – RA-R RA01-RA74 Rappahannock River
YO-A – YO-S YO01-YO69 York River
JL-A – JL-L JL01-JL59 James River, Lower (Tidal)
JM-A – JM-U JM01-JM86 James River, Middle (Piedmont)
JR-A – JR-E JR01-JR22 James River- Rivanna River
JU-A – JU-T JU01-JU86 James River, Upper (Mountain)
JA-A – JA-J JA01-JA45 James River- Appomattox River
CM-A – CM-H CM01-CM32 Chowan River-Meherrin River
CU-A – CU-R CU01-CU70 Chowan River, Upper
CL-A – CL-C CL01-CL05 Chowan River, Lower
AS-A – AS-D AS01-AS20 Albemarle Sound
RU-A – RU-V RU01-RU94 Roanoke River, Upper
RD-A – RD-S RD01-RD77 Roanoke River- Dan River
RL-A – RL-G RL01-RL24 Roanoke River, Lower
YA-A – YA-B YA01-YA07 Yadkin River-Ararat River
NE-A – NE-Z NE01-NE90 New River
TH-A – TH-L TH01-TH46 Tennessee-Holston River
TC-A – TC-H TC01-TC35 Tennessee-Clinch River
TP-A – TP-D TP01-TP19 Tennessee-Powell River
BS-A – BS-H BS01-BS35 Big Sandy River


Excerpts and Errors from the Middle Peninsula All Hazards Mitigation Plan — Another Installment of Accuracy Not Guaranteed

                                                                  By Carol J. Bova

There are so many major and minor mistakes about Mathews County in the regional All Hazards Mitigation Plan, there’s no easy way to address them at one time. Maybe it’s time to start an ongoing catalog of them to get a head start on the 2021 Mitigation Plan. We learned with previous reports like the Regional Water Supply Plan that there’s a very slim window for public input, and once a report is written, MPPDC has no interest in changing it. Even when citizens presented information at a meeting of the MPPDC about the Roadside and Outfall Ditch Report and asked that the report not be accepted until corrected, they acknowledged the errors and accepted it anyway, saying they’d correct it afterwards. The result: MPPDC staff decided there were no errors, and the mistakes in it continue to be recycled in newer reports, like the recent Virginia Coastal Policy Center’s Ditch Maintenance Study. That one involved a $40,000 grant, examined one ditch, and came up with the wrong answers, largely due to the influence of the earlier MPPDC reports. (More on that in a future post.)

With that background in mind, let’s look at the Hazards Mitigation Plan. The Plan is 556 pages, divided into 5 parts. They are available at mppdc.org.

Mathews County is located at the eastern tip of the Middle Peninsula. The County is bordered mostly by water, with the Chesapeake Bay to the east, the Mobjack Bay to the south, the North River to the west, and the Piankatank River to the north. Except for approximately five miles that border Gloucester County, the County’s perimeter is formed by its 217 mile shoreline. (Part1, pg. 16.)

The name and location are correct, and a peninsula is largely bordered by water. A few minor details are off, like the Chesapeake Bay is to the east and south of Mathews, and the western border includes Mobjack Bay along with the North River and the Gloucester County line. The miles of shoreline number is off by 130 miles. The Virginia Institute of Marine Science reported 347.42 miles of shoreline on page 20 of the 2008 Mathews County Shoreline Inventory. Eight years should have been long enough for the MPPDC to become aware of the fact.

Image Courtesy of FEMA Region III (red notes added)

Image Courtesy of FEMA Region III (red notes showing Mathews’ area added)

The plan’s presentation of the county’s population over the years is at odds with reality.

Mathews County’s population changed little between 1840 and 1900. The population peaked in 1910 with 8,922 residents, but gradually declined over the next five decades to a low point of 7,121 in 1960. This was in keeping with a national trend of population shifts from rural to urban areas because of the increased job opportunities in the cities. The population began to grow in the 1970’s and it took until the mid 1990’s before the population reached the peak reported in 1910.

An actual graph paints a different story. After every decline in population, there’s been an upward trend. Mathews will never be an urban area, nor would most of its residents want it to be. What’s MPPDC’s purpose in distorting the description of the population pattern?

Mathews Population from U.S. Censusu 1800-2010

MPPDC’s lapses in accuracy continue on page 75 of the All Hazards Plan under Ditch Flooding Vulnerability.

Throughout the Middle Peninsula of Virginia, the network of aging roadside ditches and outfalls, serving 670 miles of roads, creates the region’s primary stormwater conveyance system.

Arithmetic is a weak point for the Middle Peninsula Planning District Commission. According to VDOT statistics, the six counties involved in this regional plan have 279 miles of primary roads and 1,358 miles of secondary roads between them. Even if I didn’t have an educated pencil, my computer says that’s 1637 miles. My Echo Alexa agrees.

Currently each locality in the region experiences inadequate drainage and as a result, roads and private properties are frequently flooded after a storm event. The lowest lying localities (ie. Mathews and Gloucester County) are more vulnerable to ditch flooding as most of their land is either at or slightly above sea level.

Mathews is part of two watersheds and seven subwatersheds all existing so rainfall not absorbed by the land can reach the rivers and Chesapeake Bay. An extensive complex of streams follows the topography which consists of gentle contours from about 3 feet in the southern salt marshes to 35 feet in the northwestern region.

“At or slightly above sea level”? No wonder MPPDC thinks a foot and a half of sea level rise will wipe out a third of Mathews.

Watch for the next installment of Accuracy Not Guaranteed when the error catalog of the Middle Peninsula All Hazards Mitigation Plan continues.

Data or Scenario?

100_1347

Updated October 23, 2020

By Carol J.  Bova

Data is factual information, as in measurements and statistics.
A scenario is a description of what could possibly happen.

When it comes to local sea level rise, I’ll go with data over scenarios.

The original post show the NOAA stations for Virginia and the 2015 numbers for all but Portsmouth which ends in 1987 and Gloucester Point which ends in 2003. Last report for Chesapeake Bay Bridge Tunnel is 2017 as of October, 2020. All other stations were updated to also show 2019 information. (Click on the link to go to the NOAA site.)
https://tidesandcurrents.noaa.gov/sltrends/mslUSTrendsTable.html

Virginia Stations

Location        Local sea level rise per year and per century
8631044 Wachapreague, Virginia
The mean sea level trend is 5.37 mm/year from 1978 to 2015 which is equivalent to a change of 1.76 feet in 100 years.  Update to 2019:  5.48 mm/yr and 1.8 feet per century

8632200 Kiptopeke, Virginia
The mean sea level trend is 3.58 mm/year from 1951 to 2015 which is equivalent to a change of 1.17 feet in 100 years. Update to 2019:  3.76 mm/yr and 1.23 feet per century

8635150 Colonial Beach, Virginia
The mean sea level trend is 4.89 mm/year from 1972 to 2010 which is equivalent to a change of 1.60 feet in 100 years. Update to 2019:  4.89 mm/yr and 1.6 feet per century

8635750 Lewisetta, Virginia
The mean sea level trend is 5.42 mm/year from 1974 to 2015 which is equivalent to a change of 1.78 feet in 100 years. Update to 2019:  5.55 mm/yr and 1.82 feet per century

8637624 Gloucester Point, Virginia
The mean sea level trend is 3.81 mm/year from 1950 to 2003 which is equivalent to a change of 1.25 feet in 100 years. Destroyed in Hurricane Isabel in 2003.

8638610 Sewells Point, Virginia
The mean sea level trend is 4.59 mm/year from 1927 to 2015 which is equivalent to a change of 1.51 feet in 100 years. Update to 2019:  4.7 mm/yr and 1.54 feet per century

8638660 Portsmouth, Virginia
The mean sea level trend is 3.76 mm/year from 1935 to 1987 which is equivalent to a change of 1.23 feet in 100 years. Last reading 1987.

8638863 Chesapeake Bay Bridge Tunnel, Virginia
The mean sea level trend is 5.93 mm/year from 1975 to 2015 which is equivalent to a change of 1.94 feet in 100 years. Update to last report in 2017:  5.92 mm/yr and 1.94 feet per century