By Carol J. Bova
There are so many major and minor mistakes about Mathews County in the regional All Hazards Mitigation Plan, there’s no easy way to address them at one time. Maybe it’s time to start an ongoing catalog of them to get a head start on the 2021 Mitigation Plan. We learned with previous reports like the Regional Water Supply Plan that there’s a very slim window for public input, and once a report is written, MPPDC has no interest in changing it. Even when citizens presented information at a meeting of the MPPDC about the Roadside and Outfall Ditch Report and asked that the report not be accepted until corrected, they acknowledged the errors and accepted it anyway, saying they’d correct it afterwards. The result: MPPDC staff decided there were no errors, and the mistakes in it continue to be recycled in newer reports, like the recent Virginia Coastal Policy Center’s Ditch Maintenance Study. That one involved a $40,000 grant, examined one ditch, and came up with the wrong answers, largely due to the influence of the earlier MPPDC reports. (More on that in a future post.)
With that background in mind, let’s look at the Hazards Mitigation Plan. The Plan is 556 pages, divided into 5 parts. They are available at mppdc.org.
Mathews County is located at the eastern tip of the Middle Peninsula. The County is bordered mostly by water, with the Chesapeake Bay to the east, the Mobjack Bay to the south, the North River to the west, and the Piankatank River to the north. Except for approximately five miles that border Gloucester County, the County’s perimeter is formed by its 217 mile shoreline. (Part1, pg. 16.)
The name and location are correct, and a peninsula is largely bordered by water. A few minor details are off, like the Chesapeake Bay is to the east and south of Mathews, and the western border includes Mobjack Bay along with the North River and the Gloucester County line. The miles of shoreline number is off by 130 miles. The Virginia Institute of Marine Science reported 347.42 miles of shoreline on page 20 of the 2008 Mathews County Shoreline Inventory. Eight years should have been long enough for the MPPDC to become aware of the fact.
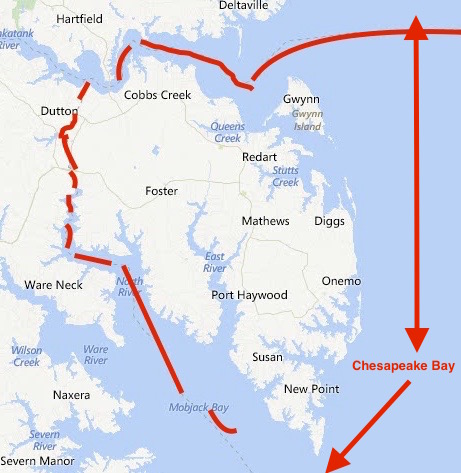
Image Courtesy of FEMA Region III (red notes showing Mathews’ area added)
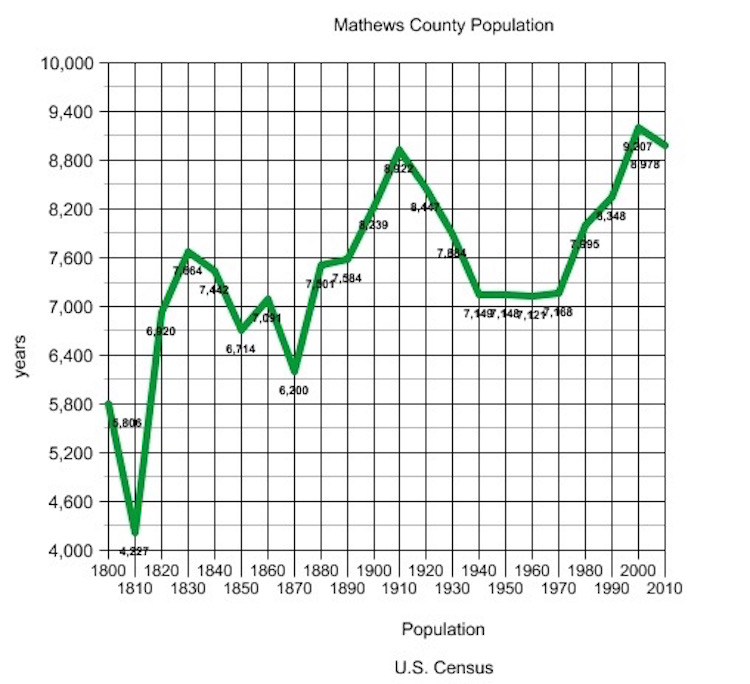
The plan’s presentation of the county’s population over the years is at odds with reality.
Mathews County’s population changed little between 1840 and 1900. The population peaked in 1910 with 8,922 residents, but gradually declined over the next five decades to a low point of 7,121 in 1960. This was in keeping with a national trend of population shifts from rural to urban areas because of the increased job opportunities in the cities. The population began to grow in the 1970’s and it took until the mid 1990’s before the population reached the peak reported in 1910.
An actual graph paints a different story. After every decline in population, there’s been an upward trend. Mathews will never be an urban area, nor would most of its residents want it to be. What’s MPPDC’s purpose in distorting the description of the population pattern?
MPPDC’s lapses in accuracy continue on page 75 of the All Hazards Plan under Ditch Flooding Vulnerability.
Throughout the Middle Peninsula of Virginia, the network of aging roadside ditches and outfalls, serving 670 miles of roads, creates the region’s primary stormwater conveyance system.
Arithmetic is a weak point for the Middle Peninsula Planning District Commission. According to VDOT statistics, the six counties involved in this regional plan have 279 miles of primary roads and 1,358 miles of secondary roads between them. Even if I didn’t have an educated pencil, my computer says that’s 1637 miles. My Echo Alexa agrees.
Currently each locality in the region experiences inadequate drainage and as a result, roads and private properties are frequently flooded after a storm event. The lowest lying localities (ie. Mathews and Gloucester County) are more vulnerable to ditch flooding as most of their land is either at or slightly above sea level.
Mathews is part of two watersheds and seven subwatersheds all existing so rainfall not absorbed by the land can reach the rivers and Chesapeake Bay. An extensive complex of streams follows the topography which consists of gentle contours from about 3 feet in the southern salt marshes to 35 feet in the northwestern region.
“At or slightly above sea level”? No wonder MPPDC thinks a foot and a half of sea level rise will wipe out a third of Mathews.
Watch for the next installment of Accuracy Not Guaranteed when the error catalog of the Middle Peninsula All Hazards Mitigation Plan continues.