Response to Dee Russell’s Statement in the Paper

By Carol J. Bova

There’s no way to answer this in the paper before the election, so here are some facts for Dee Russell and anyone else who agrees with Russell’s statement about the Draft Floodplain Ordinance being tainted by “Secret Meetings.”

Studying FEMA regulations on your own and writing down possible rewording of an ordinance is not a “secret meeting.” Discussing different viewpoints in FEMA bulletins on the phone does not constitute a “secret meeting.” Checking with FEMA and NFIP staff on how best to include information—not a secret meeting. Typing up corrections to an ordinance and letting others read them and comment to get the clearest wording is not a “secret meeting” when the draft and details were all given to Amy Dubois as she requested.

Taking Amy’s NINE spreadsheet sections of comments that were not in a usable condition and retyping them into one document anyone could download and compare to the draft ordinance line by line and cross referencing them to her unusable ones was not a secret meeting.  Giving the organized spreadsheet to her that listed, explained and gave the FEMA and NFIP sourcesr AND posting it online on a site open to the public was not a “secret meeting.”

When was the last time you saw anyone writing a document in public? I’ll bet never. You see people discussing a finished draft in public meetings, but a formal discussion of the draft floodplain ordinance never happened. It was dismissed by the former lawyer because he wanted it in the zoning ordinance. Something the board told the lawyer before him they didn’t want.

Is it required by law to be in the zoning ordinance? No. Was the lawyer told that by DCR? Yes, and he chose to ignore them and said so in a public meeting.

There were 65 comments on Amy’s spreadsheets.

The Building Official and Zoning Director offered NONE.

One general comment was from a citizen and did not relate to the ordinance itself.

First lawyer said to delete definition of market value.

Dubois/Love  made 3  comments.  One was to request an appeals process process be added. Two  were on definitions of market value and substantial improvement. DCR said the suggested Dubois/Love combination of substantial damage/substantial Improvement might be technically compliant, but they advised against it. (DCR email 6/1/18).

The other 60 came from Debbie Gibson, G. C. Morrow and me. They added necessary language according to the regulations, used FEMA recommendations, and eliminated unnecessary material. There was never anything improper in the work that was done and submitted. Each section benefits everyone in the floodplain in the same circumstances in exactly the same way. And I have an official email from a FEMA Region III spokesman that proves the former county attorney was wrong to dismiss what we did as not part of the regulations. All of it was.


Rowe Didn’t Do His Homework on His Hole in the Wall Septic System Solution

By Carol J. Bova

In his interview for the interim board position, when asked what do you think a board member should do to be effective, Mike Rowe said, “Do their homework.”

He did not do his homework on the solution he claimed for the Hole in the Wall Restaurant septic system at the Board of Supervisors meeting on September 24th. He didn’t give the board any documents or facts to support what he said, and most of his statements were incorrect.

He did not discuss how a direct discharge of treated wastewater fits the Milford Haven TMDL (Total Maximum Daily Load) from the EPA-approved water quality improvement plan or the impact to the oyster grounds and recreation adjacent to the restaurant. Even well-treated septic system effluent discharge will cause a permanent condemnation of that part of Milford Haven for shellfishing. Do we really want to discharge treated sewage effluent where people boat, kayak and use paddleboards?

Rowe, along with supervisor Amy Dubois, the county administrator, the building official, and the restaurant owner, had a private meeting with a vendor, Environmental Services of Virginia, who “gave an assessment of what he thought could be done.” The vendor “recommended an alternative system, which would be the Clearstream, and he recommended that we apply for a permit with DEQ, and once we get that, then they can design the system.”

Rowe said that without a DEQ permit you can’t move forward, but he didn’t say DEQ cannot approve a discharge permit alone. They must forward an applications for discharge into shellfish areas to the Virginia Department of Health Environmental Health Services division (VDH-EHS.)

Dr. Marcia Degen from VDH-EHS said, “There is no general approval process and the design is reviewed based on the information submitted by the design engineer.” The designer must show the selected unit can perform as required to reduce pollution and suspended solids. So an engineered design is required before the permit application is submitted.

Asked about the price for the system, which would include UV disinfection, Mr. Rowe said, “Total price tag, engineering and installation will be between $23,000 and $30,000 dollars.” He also said there is no fee for that permit from DEQ. Rowe’s cost estimate is too low, perhaps half of what would be required.

The current operating permit was issued in 1998 and allows 380 gallons of wastewater a day for 45 seats. The current Virginia Health Department (VDH) standard is  2,250 gallons a day (gpd), based on 50 gpd for each seat. (12VAC5-610 in Table 5)

The largest Clearstream treatment system is 1500 gpd. So two systems that can handle a capacity of at least 2,250 gpd are needed, including pretreatment and a UV disinfection treatment for each.

DEQ VPDES (Virginia Pollutant Discharge Elimination System) Permits are not free for commercial systems. Hole in the Wall, with  821,250  gallons per year, would fall under the category of Industrial Minor (less than 1 million gallons per year) with a new permit fee of $3,300. (9VAC25-20-110. Fee Schedule).

Rowe didn’t follow the County’s Small Purchase Policy either. Since two Clearstream units, engineering, design, permits and installation will exceed the original $30,000 estimate, County Procurement Procedures for $30,001 – $50,000 require informal solicitation of a minimum of four bidders or offerors, and an award must be made in writing. He did not mention any other bidders, nor did he present a contract for consideration by the Board before he requested approval to apply for a permit. The County Administrator also failed to mention the purchase policy requirements.

This is how the County gets tangled in difficult and costly situations – Not enough facts, not enough research, and inadequate follow through by staff.

Written and Authorized by Carol J. Bova

Fiction’s More Dramatic Than Facts When It Comes to Oysters

by Carol J. Bova

In my June 14 post, I talked about the benefits of floating cage oyster aquaculture for improving water quality. So I’ve been quite surprised at the comments objecting to Kevin Wade’s Milford Haven application to the Virginia Marine Resources Commission (VMRC). I considered each protest and found many were based on misinformation or lack of information.

Eighty-three couples or individuals filed 98 protests to the application, with 295 separate statements. I sorted those into five general groups: Business, Water Access and Safety, Environmental, Miscellaneous and Personal Impact. The first four involve factual matters and opinions about those matters. Those in the Personal Impact group are about perceptions and feelings, and I’ll discuss those in a separate post.

Business: 100 objections

Twenty-four of those were opposed to commercial development in Gwynn’s Island, some against all commercial development there. This is not only unrealistic, particularly for a working waterfront district, VMRC has no jurisdiction over this.

The other 76 objections were related to the land operations of this specific business: 28 for increased traffic, 26 for noise, 13 for smell, and 9 miscellaneous for trash, increased septic demand, hours of operation, being in the RPA, “surrounding neighbors and waterfront,” and the belief jobs will be seasonal and they won’t employ locals.

Noise, Trash, Odor:

This company has operated for 18 years at this location without problems, and some of the facilities there go back to the 1950s. If the application is approved, the natural movement of the water on the floating cages will eliminate the need for tumbling equipment. Flipping the cages periodically in the water eliminates the fouling that requires power washing. Sorting and packing will be done indoors.

If the floating cage application is turned down, tumbling and power washing will be necessary.

Traffic:

Previous business in crabs was at least twice as much as there will be even with the new aquaculture project. While heavy trucks were used to ship crabs in the 1950s, none are required for the current business or future oyster project. Since the oysters will supply the half-shell market, shipments can go out on small refrigerated trucks that will not burden the infrastructure.

Jobs & Septic Demand:

The 14-16 new full-time, year-round jobs will be open to any locals who wish to apply, at above minimum wage. Since there used to be twice as many people working there in the past, there is no issue with septic system capability.

Water Access and Safety Issues: 56 objections

These protests were on impacts to navigation, water access from private docks, safety issues and increased boat traffic.

Increased Boat Traffic:

Tending the oyster cages will be done from two boats working 6 a.m. to 2 p.m. Not exactly a marine rush hour situation.

Navigation, Access, Safety:

All of the other issues are covered by VMRC General Permit 4 and the Joint Permit Application for the project. The agencies reviewing the application are the Virginia Department of Environmental Quality (DEQ), VMRC, U.S. Army Corps of Engineers, and local Wetlands Board. The application shows:
– No riparian landowners are within 500 feet of the area in the application.
– Only 5.5 acres of the current 18.03 acre ground lease will be used.
– No dock or other access to the water from the shore will be impeded.
– No navigation channel will be impacted.
– Boundary markings will be according to state regulations.

Environmental: 42 objections

Some of these objections are the hardest to understand. Can so many people really not know what oysters do for the environment?

Pollution:

Oysters do not pollute water or cause excess sedimentation. Oysters improve water quality by filtering phytoplankton, excess nutrients and sediment from the water. When they are harvested, the nitrogen they took into their bodies and shells are permanently removed from the water. The U.S. Department of Agriculture has recognized shellfish gardening and farming “for the positive impact it has on the Chesapeake Bay.”

Impact on Eelgrass:

Eelgrass is one form of subaqueous vegetation (SAV). The map below from VIMS shows areas of SAV beds in Milford Haven. The proposed floating cage project will not be over SAV, so it cannot shade it, but when the oysters filter the water and improve the clarity, more sunlight will reach the SAV, which in turn, allows it to produce more oxygen and provide all the benefits the protestors were concerned about.

Image courtesy of VIMS SAV Ecology, Monitoring & Restoration Program, College of William & Mary.

One person quoted from what he said was a study from the University of Massachusetts about aquaculture ecosystem damage from oyster cages that destroyed eelgrass, which in turn,has impacts on migratory waterfowl. He called for an environmental impact study, but what he quoted from was not a study, it was a blog post by UMass students about an Audubon Society lawsuit against Humboldt County in California over allowing an expansion of oyster aquaculture in and over SAV beds. All the citations in that blog post were related to those problems or discussed the functions of SAV. There was no connection to the conditions specified in the local application.

Ospreys:

Concerns that the cages will interfere with ospreys looking for fish are unfounded. Ospreys hunt from the air and clearer water will help them locate fish more easily.

Miscellaneous: 23 objections

Five gave no reason.

Four said it would interfere with potential archeological surveys, although VMRC General Permit #4 requires permittees “to cooperate with agencies of the Commonwealth in the recovery of archeological remains if deemed necessary.”

Three felt there’d be a negative impact on tourism, even though Kevin Wade wrote in a letter to the editor of the Gazette Journal, “We’ll add to the eco-tourism goals of Mathews County, showing the waterman’s lifestyle, even though it’s a slightly different form, and the benefits of aquaculture as a sustainable model.”

The remaining eleven objections felt Gwynn’s Island was an historic district and the project did not belong there. In 1895, however, in the Report of the Chief Engineer of the Army to Congress, Major C.E.L.B. Davis reported about Gwynn’s Island: “It has a population of 600 to 700, chiefly engaged in fishing and oystering.” The location has been a working waterfront for over 200 years. What on Gwynn’s Island is more a part of its history than that?

So far, facts have not made a difference in the attitudes of those protesting this project, but the facts are spelled out here.

Personal Impact

I will discuss this group of 74 objections related to property value, view, and quality of life in the next post on InsideTheCrater.com.

Oysters and Cleaner Water

By Carol J. Bova

When I learned of the Island Seafood oyster aquaculture project application to the Virginia Marine Resources Commission, I realized this will be the first significant progress toward our water quality improvement goals for the area. In 2012-2013, I was one of four citizens on the Steering Committee of the Water Quality Implementation Plan for Gwynns Island, Milford Haven and Piankatank River Watersheds.

Floating Cage Oyster Aquaculture

History
We struggled to get the state agencies to adjust the numbers of people and animals they used to calculate water quality goals to more accurate levels, but also to go beyond blaming septic systems for the areas with E. coli. The Department of Conservation and Recreation (DCR) was the lead agency, and they did make a number of adjustments in the numbers of people, dogs, wildlife and farm animals based on citizen research.

Same Problems Still Exist
We were unable, though, to convince the authorities that we couldn’t expect to reduce the E. coli numbers until the Department of Transportation road drainage system allowed oxygenated water from fresh rainfalls to reach the major creeks and rivers. Six years later, headwaters and other streams still cannot flow through blocked pipes under roads, and stormwater still accumulates in roadside ditches, losing oxygen and growing cyanobacteria. While not monitored by the Virginia Health Department, cyanobacteria can produce toxins, and VIMS did find a low level of toxic microcystins in a sample from ditch water pictured below:

Oscillatoria (cyanobacteria) Identified in Mathews by VIMS.

E. coli Can Survive Without Oxygen if Protected From Sunlight
When E. coli encounters waters without sufficient oxygen, It enters a viable, but non-culturable state. This means while its predators, in the form of beneficial bacteria, die off without oxygen, E. coli stops reproducing and settles into bottom sediments where it’s protected from sunlight. When storms stir up the waters, and oxygen does reach the E. coli, it once more begins reproducing, without any new input from humans or animals.

Commonwealth Not Ready for Novel Ideas Then
Our 2012 suggestion to provide aeration and probiotics to the headwaters of contaminated larger streams was rejected by the Health Department staff on the committee. They refused to believe E. coli could survive in sediment beyond a few days. Journal references from researchers around the world did not convince them.

In 2015, news accounts of an experiment at Annapolis showed using aeration and probiotic bacteria did reduce E. coli levels by reducing mucky sediments, improving oxygen levels, and restoring beneficial bacteria. (Chesapeake Style, pg. 37). To my knowledge, no one in Virginia has followed this idea. Nothing has improved the E. coli levels here to any measurable extent.

Hope at Last
Now, with the Milford Haven oyster aquaculture project, in spite of the VDOT drainage failures, we have a new way to improve the water quality. We can look forward to improvement in the E. coli numbers as oysters filter millions of gallons of water and remove sediment and excess nutrients from the upper water column. Nearby subaqueous vegetation will benefit from more sunlight reaching the beds and add more oxygen to the Bay’s waters as they grow. So as a result of a waterfront business operation, we end up with cleaner water, less E. coli, more SAV and more oxygen in the water–at no expense to the County or Commonwealth.

The Mayor of Tangier Island is Right

By Carol J. Bova

(Originally posted as a response to James A. Bacon’s blog, “Does “Ooker” Estridge Know Something the Experts Don’t” on Bacon’s Rebellion about sea level rise impacting Tangier Island in the Chesapeake Bay. Tangier Island is losing about 16 feet a year on its western side and 3 on the eastern.)

“Ooker” Estridge is right that Tangier Island’s problem is erosion, and he’s got hard science behind that statement. While sea level rise is a long-term issue and increased monitoring of local impacts is important, that’s not why Tangier Island is endangered. Lewisetta is the nearest tide gauge and not out in the Bay, but the local sea level trend is 1.7 ft in 100 years, which is less than a quarter inch per year. So there’s more in play there.

“Storms provide the greatest source of coastal change on barrier islands due to storm surge and strong waves. Surging water and stronger waves can erode barrier island beaches and, if the surge is high enough, result in overwash, breaching, or back bay flooding… .” (U S Army Corps of Engineers, North Atlantic Coast Comprehensive Study: Resilient Adaptation to Increasing Risk. January 2015.)

Tangier Island is a barrier island, and like all barrier islands and barrier beaches, it’s made up of sand-sized sediment that is deposited, moved, and reformed by wind and waves. Political positions about sea level rise have ignored the reality of longshore transport of sediment (also called longshore drift). If the sand supply is not maintained, the island erodes to the point where it is inundated by the tides. No one realized in the 1700s how fragile these bodies are, or that it wasn’t a good idea to build on them.

NOAA relates the story of Tucker Island in New Jersey, settled in 1735, and how attempts to stop longshore transport of sand using jetties in 1924 eventually caused the loss of that barrier island.

We have the same problem on the Chesapeake Bay coastline in Mathews County where we’ve just about lost Rigby Island, another barrier island, and have a breach in the Winter Harbor barrier beach caused by a nor’easter in 1978.  Beach replenishment could repair it and restore the protective function of the barrier beach against storm surge flooding, but the Virginia Institute of Marine Science and the Corps of Engineers chose instead to only supplement the tiger beetle habitat below the breach, allowing the breach to continue to widen.

The Virginia Department of Transportation helped create the problem by removing 5-7 feet of sand from the beaches to the north of Winter Harbor in the 1930s and 1940s to use to build roads in two counties. (This was confirmed by a memo in VDOT’s files.)

The Corps of Engineers also helped create the problem by working with the County to open a channel directly from Garden Creek to the Bay. The jetties they built to keep the channel open failed, but they also prevented the movement of sand southward to the Winter Harbor barrier beach leading to its breach.

Wetlands Watch joined with the Middle Peninsula Planning District Commission (MPPDC) in blaming sea level rise for the loss of the barrier beach and barrier island around the New Point Comfort Lighthouse in the NOAA grant-funded MPPDC Climate Change Adaptation Phase 2 report and repeated the claim in the 2011 Phase 3 report with slides implying sea level rise causes the lighthouse to be left on a tiny island. One has picture of the lighthouse in 1885 and “today” with the caption, “shoreline has moved 1/2 mile.” Another says, “TODAY – 5 ft water covers more than 1,000 plated subdivision lots.”


The platted subdivision only existed on paper because the project failed financially in 1905. Much of the barrier island and barrier beach were lost in the 1933 August and September hurricanes, and the rest lost through longshore transport after that.

The reports include those slides and a mocking cartoon about the “Coconut Telegraph,” alluding to person-to-person communication between Mathews citizens, as part of Power Point presentations made throughout Virginia and in other areas on sea level rise by MPPDC Executive Director, Lewie Lawrence.


When local observations are ignored in favor of political positions, everyone loses. Tax money is spent on the wrong responses and real problems get worse because they’re not acknowledged.

People who come from generations who’ve lived in the same place may not have the university degrees, but they have knowledge that could benefit the universities and government agencies who disregard them.

In the http://www.nad.usace.army.mil/Portals/40/docs/NACCS/NACCS_main_report.pdf”Hurricane Sandy report, the Corps of Engineers places barrier island and barrier beach preservation among the highest Coastal Storm Risk Management and Resilience measures, short of removing buildings from the coast.


Too bad no one considered this kind of replenishment for Tangier Island while there was a better chance of saving it.


The National Watershed Boundary Dataset – Chesapeake Bay Watersheds and Virginia River Basins

By  Carol J Bova

In 2001, the National Watershed Boundary Dataset (NWBD) became the official hydrologic unit system of the United States. Virginia made some adjustments to simplify identifying smaller watershed units. You might never need the details here, but if you do, this should help because an accurate list is not always easy to locate. A special thank you to Sam Austin and Randy McFarland of the USGS for their help.

Watershed Hydrologic Unit Code (HUC) Level, Name and Unit Size

1st Order = Region            HUC = 2 digits         Avg. 177,560 sq. miles

2nd Order = Subregion      HUC = 4 digits         Avg. 16,800 sq. miles

3rd Order = Basin              HUC = 6 digits         Avg. 10,596 sq. miles

4th Order = Subbasin         HUC = 8 digits         Avg. 703 sq. miles

5th Order = Watershed       HUC = 10 digits       40,000 – 250,000 acres

6th Order = Subwatershed   HUC = 12 digits     10,000 – 40,000 acres

The Virginia Department of Conservation and Recreation (DCR) describes River Basins as follows:  Although 3rd level units of the WBD are called “Basins,” these units are not necessarily the equivalent of river basins as described in many state programs. For instance, DCR frequently divides the commonwealth into 14 River Basins for program usage as follows: Potomac River, Rappahannock River, York River, James River, Atlantic Ocean Coastal, Chesapeake Bay Coastal, Chowan River, Albemarle Sound Coastal, Roanoke River, Yadkin River, New River, Clinch-Powell Rivers, Holston River and Big Sandy River. Except for offshore ocean claims, all of Virginia is accounted for in these basins.

Virginia developed a new four-character code for its 5th and 6th level units. The first two characters are based on the major stream name in the basin, or portion of the basin, where the unit is located. The two digits that follow are numbered in sequence by drainage flow from headwaters to mouth.

These four-character identifiers are not part of the national WBD standard. The Virginia system is called the Virginia National Watershed Boundary Dataset (VaNWBD). Originally released in 2006, the VaNWBD has been updated a number of times, and currently is referred to as version 5 (VaNWBDv5).

The Department of Conservation and Recreation (DCR) website lists the internal coding for all 5th and 6th level units of the VaNWBDv5 at http://www.dcr.virginia.gov/soil-and-water/hu. The Virginia coding for 5th and 6th level units for the Chesapeake Bay watersheds and sub-watersheds of the VaNWBDv5 from Table 4 shown below.

CHESAPEAKE BAY VIRGINIA WATERSHEDS AND SUB-WATERSHEDS
5th LEVEL UNITS (VAHU5) 6th LEVEL UNITS (VAHU6) DRAINAGE
PL-A – PL-U PL01-PL74 Potomac River, Lower
PU-A – PU-F PU01-PU22 Potomac River, Upper
PS-A – PS-T PS01-PS87 Potomac River-Shenandoah River
CB-A – CB-O CB01-CB47 Chesapeake Bay/Chesapeake Bay Coastal
AO-A – AO-H AO01-AO26 Atlantic Ocean Coastal
RA-A – RA-R RA01-RA74 Rappahannock River
YO-A – YO-S YO01-YO69 York River
JL-A – JL-L JL01-JL59 James River, Lower (Tidal)
JM-A – JM-U JM01-JM86 James River, Middle (Piedmont)
JR-A – JR-E JR01-JR22 James River- Rivanna River
JU-A – JU-T JU01-JU86 James River, Upper (Mountain)
JA-A – JA-J JA01-JA45 James River- Appomattox River
CM-A – CM-H CM01-CM32 Chowan River-Meherrin River
CU-A – CU-R CU01-CU70 Chowan River, Upper
CL-A – CL-C CL01-CL05 Chowan River, Lower
AS-A – AS-D AS01-AS20 Albemarle Sound
RU-A – RU-V RU01-RU94 Roanoke River, Upper
RD-A – RD-S RD01-RD77 Roanoke River- Dan River
RL-A – RL-G RL01-RL24 Roanoke River, Lower
YA-A – YA-B YA01-YA07 Yadkin River-Ararat River
NE-A – NE-Z NE01-NE90 New River
TH-A – TH-L TH01-TH46 Tennessee-Holston River
TC-A – TC-H TC01-TC35 Tennessee-Clinch River
TP-A – TP-D TP01-TP19 Tennessee-Powell River
BS-A – BS-H BS01-BS35 Big Sandy River


Beavers Love BMPs
(Big Messy Projects)

By G. C. Morrow

Wards Corner Outfall Beaver Dam

Wards Corner Outfall Beaver Dam

I decided to look at previous projects to see if I could find a pattern in their failures. It is extremely hard to conceive that these projects with their half million plus engineering budgets fail so miserably at their purpose. At first glance, it appears that the engineers are attempting to move their drainage conveyances to more accessible locations, but even the greenest of engineers should know better than to try to drain water uphill.  (G. C. Morrow, June 15, 2016)http://insidethecrater.com/714-2

Most of the environmental and pollution problems we are facing in stormwater management can be traced to very simple explanations and solutions. I warned in 2016, “South of Wards Corner, there are three outfalls much lower in elevation than the one at Wards Corner, and they are necessary to handle several hundred acres of stream flow, as well as roadside drainage.”

Beavers are drawn to the sound of water whose flow is disrupted. They have invaded the Wards Corner outfall, as well as two unmaintained neighboring outfalls.

I saw three dams at Wards Corner this week. At one place, the dam filled the outfall to the top, about 6-8 feet deep. Water was overflowing next to a 36-inch pipe and cut through the earth surrounding the pipe to create a spillway. This eroded soil is going downstream into the marsh.

Similar erosion has occurred around the 36-inch pipe at the start of the outfall off the shoulder of route 198. Old-fashioned concrete endwalls would have prevented the erosion at both locations, but today, only cosmetic plastic endwalls are used–and this project didn’t even use those.

We won’t know until the dams are cleared exactly how the beavers managed to block the flow so well. If the outfall had functioned properly, draining within 2-3 days after rainfall, there shouldn’t have been enough water to attract beavers in the first place, especially since the outfall is uphill of most of the area it’s supposed to drain.

A large number of saplings, stripped of their bark, are lined up on the banks near the dam, ready to be used to enlarge or repair it. The beavers will continue to stop the water as long as it’s moving slowly enough for them to harness it to float the saplings into place.

It appears that using rock checkdams to slow down the water flow in a rural environment is not the right answer. Putting the drainage in the right place might have been a better idea.

Makes you wonder why the state spent $1.6 million to cause perpetual flooding of downstream locations. A much smaller amount could have restored the outfall to Stutts Creek behind the high school, and cleared or even replaced the pipes in the VDOT easement along the football field. Doing that would have conveyed the water from Route 198 to the creek and not let it flood the school and park properties. Now, the county is being asked to fund half the cost of the restoration through revenue sharing or continue to suffer the damage of its property. It may be that VDOT’s failure to maintain an outfall inventory meant the designers didn’t know about the existing outfalls.

At some point, VDOT designers and engineers have to use real world considerations and get away from their laptop configurations. Overbuilding to create a new construction project, instead of developing a simpler restoration of existing structures, is not a better value-based decision in the long run, even if federal money is involved. And that era may be ending soon.


The following pictures are taken at the shoulder on Route 198 looking toward the area with the beaver dam showing the progressive erosion.

Wards Corner 2012

Wards Corner 2012

2013--eroded area 4-feet wide

2013–eroded area 4-feet wide

2014

2014

2015

2015

2016

2016

Excerpts and Errors from the Middle Peninsula All Hazards Mitigation Plan — Another Installment of Accuracy Not Guaranteed

                                                                  By Carol J. Bova

There are so many major and minor mistakes about Mathews County in the regional All Hazards Mitigation Plan, there’s no easy way to address them at one time. Maybe it’s time to start an ongoing catalog of them to get a head start on the 2021 Mitigation Plan. We learned with previous reports like the Regional Water Supply Plan that there’s a very slim window for public input, and once a report is written, MPPDC has no interest in changing it. Even when citizens presented information at a meeting of the MPPDC about the Roadside and Outfall Ditch Report and asked that the report not be accepted until corrected, they acknowledged the errors and accepted it anyway, saying they’d correct it afterwards. The result: MPPDC staff decided there were no errors, and the mistakes in it continue to be recycled in newer reports, like the recent Virginia Coastal Policy Center’s Ditch Maintenance Study. That one involved a $40,000 grant, examined one ditch, and came up with the wrong answers, largely due to the influence of the earlier MPPDC reports. (More on that in a future post.)

With that background in mind, let’s look at the Hazards Mitigation Plan. The Plan is 556 pages, divided into 5 parts. They are available at mppdc.org.

Mathews County is located at the eastern tip of the Middle Peninsula. The County is bordered mostly by water, with the Chesapeake Bay to the east, the Mobjack Bay to the south, the North River to the west, and the Piankatank River to the north. Except for approximately five miles that border Gloucester County, the County’s perimeter is formed by its 217 mile shoreline. (Part1, pg. 16.)

The name and location are correct, and a peninsula is largely bordered by water. A few minor details are off, like the Chesapeake Bay is to the east and south of Mathews, and the western border includes Mobjack Bay along with the North River and the Gloucester County line. The miles of shoreline number is off by 130 miles. The Virginia Institute of Marine Science reported 347.42 miles of shoreline on page 20 of the 2008 Mathews County Shoreline Inventory. Eight years should have been long enough for the MPPDC to become aware of the fact.

Image Courtesy of FEMA Region III (red notes added)

Image Courtesy of FEMA Region III (red notes showing Mathews’ area added)

The plan’s presentation of the county’s population over the years is at odds with reality.

Mathews County’s population changed little between 1840 and 1900. The population peaked in 1910 with 8,922 residents, but gradually declined over the next five decades to a low point of 7,121 in 1960. This was in keeping with a national trend of population shifts from rural to urban areas because of the increased job opportunities in the cities. The population began to grow in the 1970’s and it took until the mid 1990’s before the population reached the peak reported in 1910.

An actual graph paints a different story. After every decline in population, there’s been an upward trend. Mathews will never be an urban area, nor would most of its residents want it to be. What’s MPPDC’s purpose in distorting the description of the population pattern?

Mathews Population from U.S. Censusu 1800-2010

MPPDC’s lapses in accuracy continue on page 75 of the All Hazards Plan under Ditch Flooding Vulnerability.

Throughout the Middle Peninsula of Virginia, the network of aging roadside ditches and outfalls, serving 670 miles of roads, creates the region’s primary stormwater conveyance system.

Arithmetic is a weak point for the Middle Peninsula Planning District Commission. According to VDOT statistics, the six counties involved in this regional plan have 279 miles of primary roads and 1,358 miles of secondary roads between them. Even if I didn’t have an educated pencil, my computer says that’s 1637 miles. My Echo Alexa agrees.

Currently each locality in the region experiences inadequate drainage and as a result, roads and private properties are frequently flooded after a storm event. The lowest lying localities (ie. Mathews and Gloucester County) are more vulnerable to ditch flooding as most of their land is either at or slightly above sea level.

Mathews is part of two watersheds and seven subwatersheds all existing so rainfall not absorbed by the land can reach the rivers and Chesapeake Bay. An extensive complex of streams follows the topography which consists of gentle contours from about 3 feet in the southern salt marshes to 35 feet in the northwestern region.

“At or slightly above sea level”? No wonder MPPDC thinks a foot and a half of sea level rise will wipe out a third of Mathews.

Watch for the next installment of Accuracy Not Guaranteed when the error catalog of the Middle Peninsula All Hazards Mitigation Plan continues.

Consider the Source: University of Virginia Institute for Environmental Negotiation Strategy List

The Mathews County Planning Commission is considering a list of “tools” MPPDC provided as ideas for a county whose goal is “living with the water.” The  MPPDC (Middle Peninsula Planning District) suggestions for Mathews County’s comprehensive plan revision focus more on how not to develop the county’s land resources than any future use planning. There is a heavy emphasis on urban stormwater management which doesn’t fit our rural and relatively undeveloped county.

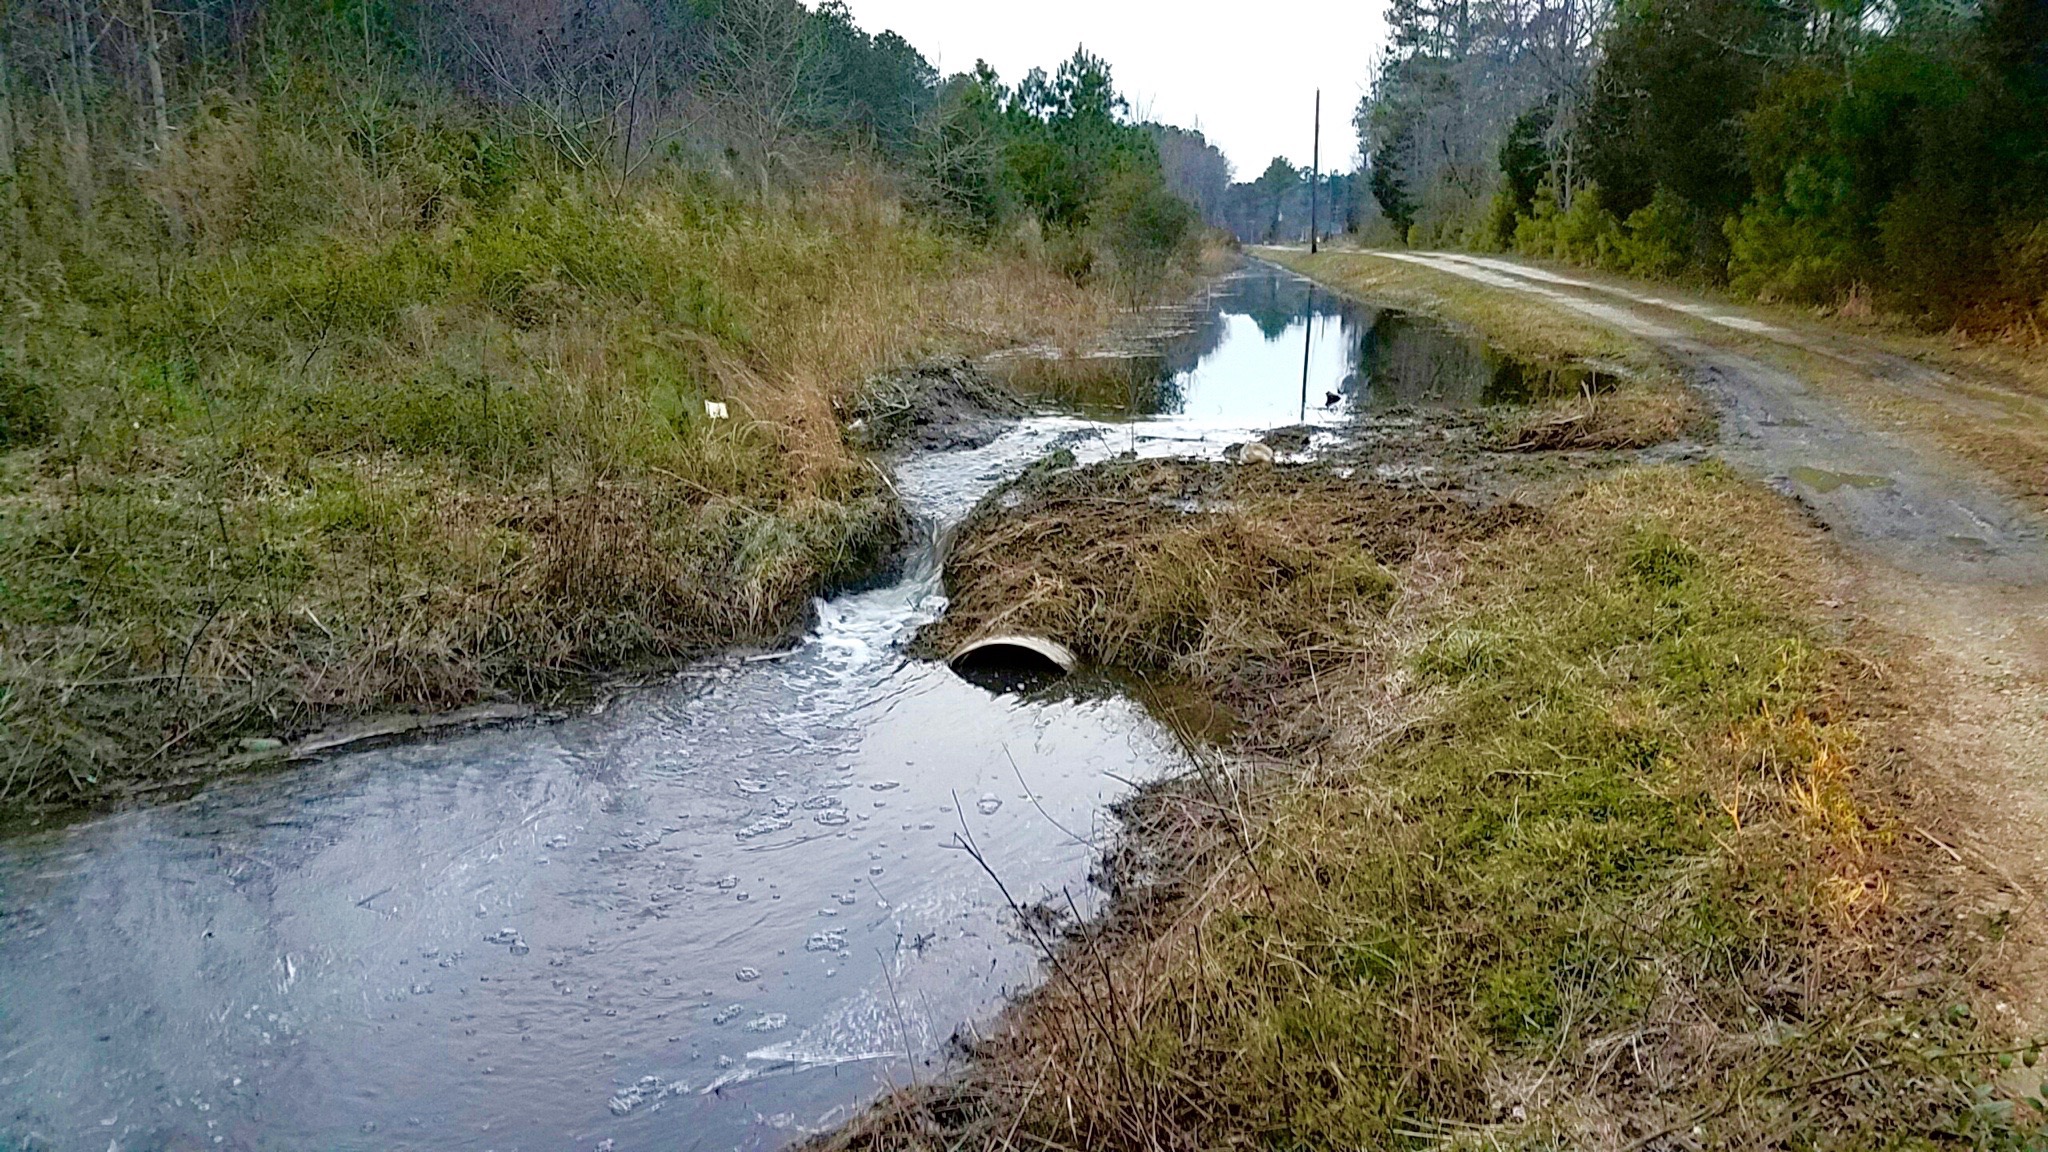
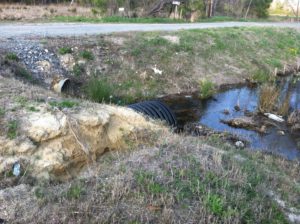
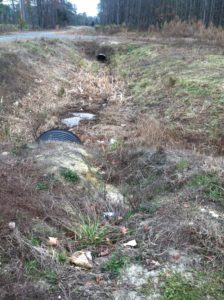
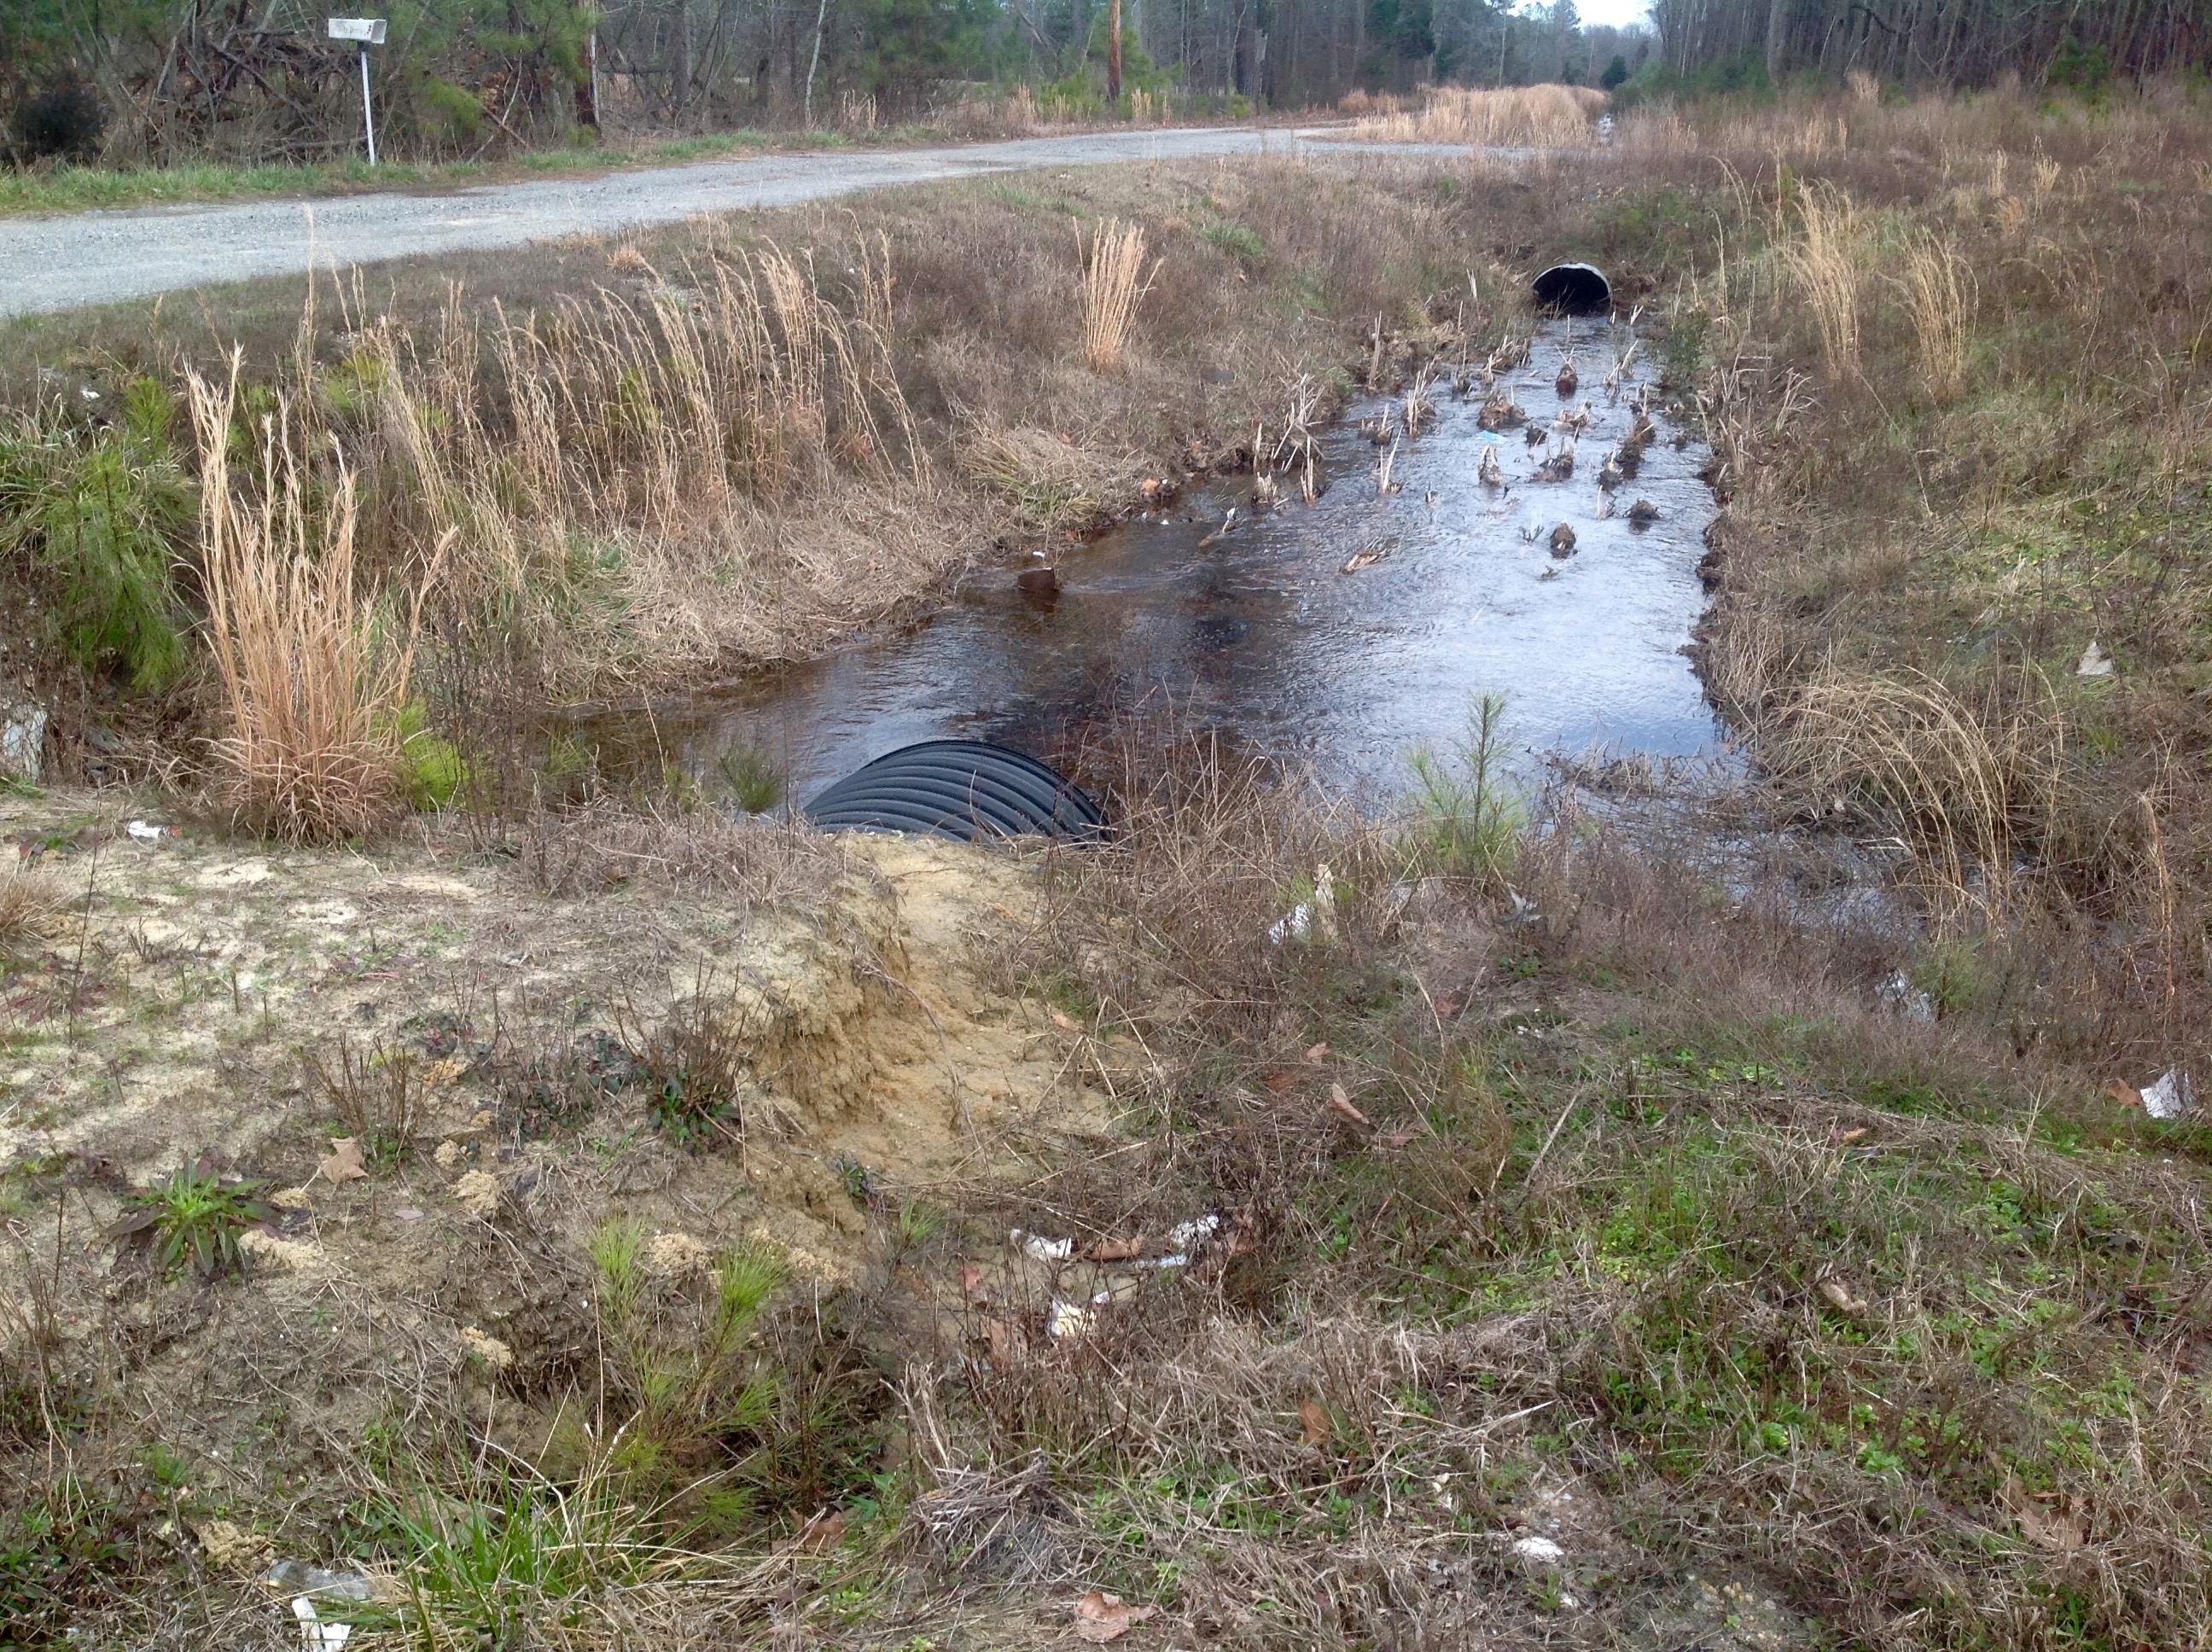
Our rural stormwater needs are centered on getting the Virginia Department of Transportation to fix its failing state road drainage systems that are flooding private property and woodlands. To their credit,  VDOT seems to be hearing that message and is reaching out to partner with the county in working on the long-neglected problem. But there isn’t one word about VDOT’s drainage issues or the state’s responsibility in the “toolbox.”

The MPPDC tools do include the possibility of creating special hazard districts and Imposing new taxes and stormwater fees, and of course, the pet project of Executive Director Lewie Lawrence, the creation of a Ditching Authority. This would be a regional authority that would decide how much to tax landowners for the maintenance and repair of roadside and outfall ditches that cross their land across the Middle Peninsula. This Authority would act without the counties’ involvement or control if enabling legislation is created to permit its formation.

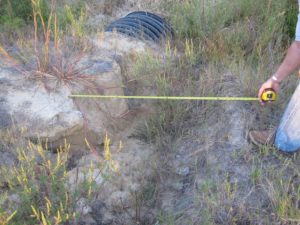
The basic idea ignores the fact that most of the roadside ditches are within the VDOT right-of-way, and where they’re not, there are easements for them, even though some of these were covered by consent of landowners, some dating back to the late 1800s. Others are included in right-of-way deeds as granting any land necessary “to construct, improve and maintain any drain ditches or other drainage facilities that may be needed for the proper and adequate drainage of said Route.” Also ignored is the fact is the number of outfalls that are natural streams that VDOT excavated. They are still considered streams by the Commonwealth, and landowners are not responsibile for their maintenance.

The MPPDC tools offer at least 11 ways to trade away Mathews land for cash payments or tax credits now that will prevent development here in Mathews forever. Some will allow urban developers to ignore an urban area’s zoning or environmental regulations and mitigate their violations by trading their building or ongoing pollution for unspoiled Mathews land. Transfer of development rights allows the urban over-development and eliminates ours. Polluters can keep polluting and substitute credits for locking in our land from development and paying us for the privilege. This doesn’t do anything to help the Bay. We’re already doing our part to help it recover, but the urban developers can continue to impair and damage it.

Conservation easements can be a good thing, but how do they fit into the County’s future? No one is looking at the long term effects of the MPPDC efforts to gather up these easements, which it can then transfer to other nonprofits. Are they going to become income sources for allowing pollution and overdevelopment elsewhere? That’s not explained in the toolbox list. So where did some of these ideas originate? Following is the 7-page strategy list included in a 2013 report to the legislature. Some of the strategies are sound, but others are being used now as part of the MPPDC toolbox against the best interests of Mathews for the long run.

Carol J. Bova

================================================================

RECURRENT FLOODING STUDY  FOR TIDEWATER  VIRGINIA
This report identifies recurrent flooding issues throughout Tidewater
Virginia, examines predictions for future flooding issues and evaluates a
global set of adaptation strategies for reducing the impact of flood events.

Report submitted to the Virginia General Assembly
January 2013

credit for recurrent flooding

Pages 128-134.  Full document at:

http://ccrm.vims.edu/recurrent_flooding/Recurrent_Flooding_Study_web.pdf


Section 4.6 IEN strategy list

The following lists are presented courtesy of the University of Virginia Institute for Environmental Negotiation.


Local Government Tools for Addressing Sea Level Rise in Virginia

DRAFT

Planning Tools To Be Considered for Discussion at Focus Groups

Compiled by the University of Virginia Institute for Environmental Negotiation

Sources cited below

January 2012

LAND USE: Examples of tools relating to land use concerns

  1. Update the local Comprehensive Plan to:
    1. Establish the rate of estimated sea level rise and time period over which it may occur.
    2. Designate areas vulnerable to sea level rise.
    3. Site future public infrastructure and capital improvements out of harm’s way.
    4. Provide the scientific basis to justify changes in land use decision-making, including an analysis of likely sea level rise hazards (inundation, flooding, erosion), and vulnerabilities (to specific areas, populations, structures and infrastructure).
    5. Plan responses to sea level rise.1
  1. Using data gathered on potential sea level rise and predicted flooding, update existing or designate new inundation zones or flood plain areas.2
  1. Integrate vulnerability assessments and sea level rise considerations into the locality’s existing Wetlands Ordinance.3
  1. Revise local zoning and permitting ordinances to require that projected sea level rise impacts be addressed to minimize threats to life, property, and public infrastructure and ensure consistency with state and local climate change adaptation plans.4
  1. Use overlay zoning to protect shorelines and other vulnerable areas. Overlay districts could prohibit shoreline protection structures, implement shoreline setbacks, restrict 1 future development, lower non-conforming use thresholds, or raise “free board” building code requirements. Shoreline overlay districts could take the form of either:
    1. A fixed-distance zone along the shoreline that would extend across all existing shoreline zoning districts; or
    2. A variable, resource-based zone, based on a scientific inventory of existing shoreline resources. The zone would vary in distance from the water line according to the identified resources.5
  1. Designate specific thresholds of land disturbance in square footage or acres that trigger a Water Quality Inventory Assessment.6
  1. Under section 15.2-2286 of the Virginia Code, offer tax credits to landowners who agree to voluntarily “downzone” their property.7
  1. Offer Use Value Assessments for owners who preserve shoreline property as open space or Wetlands Tax Exemptions to owners who agree to preserve wetlands and riparian buffers. These strategies are authorized under Virginia Code sections 58.1-3230 and 58.1-3666, respectively.8
  1. Enter into voluntary agreements with landowners to establish “rolling easements” with boundaries that shift as the mean low sea level rises. These would allow landowners to continue with their current land uses until sea level rise actually occurs. At this time, the concept of “rolling easements” is still relatively new.9
  1. Extend Resource Protection Area and Resource Management Areas under the Chesapeake Bay Preservation Act (CBPA) ordinance. These areas can be extended if specific performance criteria that contribute to the stated goals of the CBPA (pollution reduction, erosion and sediment control, stormwater management) are established.10

NATURAL RESOURCES: Examples of tools relating to concerns

1.Prevent the erosion of storm water canals and shoreline by regularly removing trash, vegetation, sands, and other debris.11

  1. Restore prior-converted wetlands to provide storage and filtration and mitigate storm flows and nutrient loading.12
  1. Require new landscaping to incorporate flood and salt-water tolerant species and focus on creating buffers and living shorelines to reduce erosion.13
  1. Continue implementing beach replenishment and nourishment efforts.14
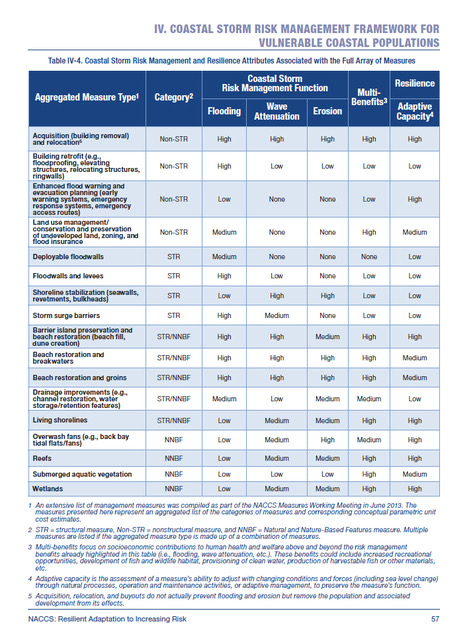
  1. Where possible, adopt shoreline protection policies that encourage the use of living shorelines rather than shoreline hardening.15 Where this is not feasible, protect land and buildings from erosion and flood damage using dikes, seawalls, bulkheads, and other hard structures.16
  1. Encourage shoreline property owners to implement shoreline management practices, including managing marshland and constructing stone sills, breakwater systems, revetments, and spurs.17
  1. Expand the adoption of accepted soil-conservation agricultural management practices to reduce erosion and polluted runoff.18
  1. Institute engineering strategies to mitigate saltwater intrusion into freshwater aquifers, including the construction of subsurface barriers, tide control gates, and artificially recharging aquifers.19
  1. Establish and maintain corridors of contiguous habitat along natural environmental corridors to provide for the migration and local adaptation of species to new environmental conditions.20
  1. Develop a price-based accounting system for ecosystem services.21
  1. Provide local businesses with information on the importance of maintaining the health of shorelines.22 (good voluntary approach if the case can be made “why do this”
  1. Remain aware of the effects that flood mitigation strategies, such as beach replenishment, have on wildlife.23

SAFETY AND WELFARE: Examples of tools relating to safety and welfare concerns

  1. Develop sea level rise action plans for critical local infrastructure. If existing transportation infrastructure is at risk, “develop plans to minimize risks, move infrastructure from vulnerable areas when necessary and feasible, or otherwise reduce vulnerabilities.”24
  1. Implement an early warning system for flooding that would monitor rainfall and water Levels and notify relevant government agencies and the general public in the event of an emergency.25
  1. Improve the ability of local infrastructure to efficiently handle drainage in the event of increased flooding. This could involve minimizing the construction of new impervious surfaces in flood-prone areas.26
  1. Amend existing zoning ordinances to require increased building elevations and setbacks, flood-proofing, and reduced density for new construction within flood zones.27
  1. Improve and enhance traffic rerouting and emergency evacuation protocols related to flooding events.28 (First responders love this stuff)
  1. Ensure that hospitals, evacuation refuge sites, fire and emergency rescue facilities, and key transportation routes are outside of inundation zones or are secured against projected flooding.29
  1. Redirect new infrastructure development away from low-lying neighborhoods and other at-risk areas, and elevate and armor existing critical infrastructure.30
  1. Require private sector owners of infrastructure to conduct sea level rise vulnerability assessments and develop their own sea level rise adaptation plans as a condition for permit approval.31
  1. Encourage the graduated repurposing of structures that are rendered unsuitable for their current use by sea level rise.32,33
  1. Gradually withdraw public services in flooded areas.34, 35

QUALITY OF LIFE: Examples of tools to address quality of life concerns

  1. Involve businesses in the planning process to prevent the loss of shoreline business and to mitigate the impacts of increased flooding and sea level rise.36 (could be a good voluntary strategy for public awareness.)24
  1. Establish a Transfer of Development Rights program to allow the owners of at-risk shoreline properties to sell development rights to upland landowners.37
  1. Permit the use of Onsite Density Transfers, which allow developers to subdivide lots into smaller and denser parcels if they preserve a portion of the lot as open space and cluster the subdivided parcels.38
  1. Purchase flooded property from landowners.39
  1. Organize coastal businesses and homeowners to appeal to insurance companies for affordable rates and deductibles.40
  1. Organize coastal businesses and homeowners to petition local, state, and federal politicians to address sea level rise.41
  1. Require realtors to disclose the threat of sea level rise and the responsibilities of shoreline owners to potential purchasers of shoreline properties.42
  1. Implement special taxing districts that cover the real, life-cycle costs of providing government services in high-risk flood zones, resulting in higher taxes for property-owners in those zones.43
  2. Use a financial regulatory program to discourage increasingly risky investments along the shoreline. Examples of existing programs with similar aims include:
    1. The state regulation of the property loss insurance sector to reflect higher risk from sea level rise, and
    2. Placing conditions on economic development to require the completion of a long-range vision and plan that addresses sea level rise and flood risk.44
  3. Hold a series of meetings with stakeholder groups to discuss and gauge potential sea level rise impacts to the region or locality.45
  1. Educate local elected officials on sea level rise, and the predicted impacts to the region or locality.46
  1. Present data in easily-understood terms, such as X acres will be flooded, X homes lost, and X impacts to wildlife.
  1. Extend media coverage to issues related to sea level rise to increase public awareness and to help citizens prepare for emergencies. This can include the use of social media, such as Facebook, as well as traditional media, including radio, television, and newspapers.48
  1. Increase public outreach, including press conferences, information sessions, community events, public meetings, and exhibits on sea level rise at libraries, aquariums, and museums.49
  2. Using modern technologies such as GIS mapping software, develop education programs for residents as well as students in local and regional schools.50
  1. Educate residents about the role that fertilizing, vegetation removal, and litter play in increasing flooding, erosion, and property damage.51
  1. Provide landowners with accurate data on the current and future vulnerability of their property to sea level rise as well as best managing practices for mitigating the effects of increased flooding.52
  1. Raise public awareness of areas prone to flooding through increased signage.53

OTHER TOOLS to consider

  1. Craft a “Community Resilience” policy statement emphasizing the need for science-based vulnerability assessments, adaptation planning, education and public engagement, and the development of flexible regulatory and non-regulatory strategies for addressing sea level rise.54
  2. Compile a sea level rise impact assessment. This is often a long-term, multi-phase effort. Steps can include:
    1.  Assembling an advisory workgroup.55
    2. Identifying flood zones and at-risk populations.
    3. Mapping regional and county sea level rise predictions to show impacts to existing development and natural areas; and
    4. Assessing and prioritizing economic and ecological vulnerabilities to sea level rise.

===================================

1 Georgetown Climate Center, Stemming the Tide: How Local Governments Can Manage Rising Flood Risks –
Review Draft 3 11 (May 2010), on file with author.
2 See id. at 9-10.
3 Virginia Polytechnic Institute and State University (“Virginia Tech”), Building Resilience to Change: Developing
Climate Adaptation Strategies for Virginia’s Middle Peninsula – DRAFT 16 (October 2011), on file with author.
4 L. Preston Bryant, Jr., Governor’s Commission on Climate Change, Final Report: A Climate Change Action Plan 35
(Dec. 15, 2008), on file with author.

5 Virginia Tech, supra note 2 at 13, 32, 43.
6 Id. at 16.
7 Georgetown Climate Center, supra note 1 at 18.
8 Virginia Tech, supra note 3 at 43.
9 Id. at 36, 43; see also Georgetown Climate Center, supra note 1 at 19-23.
10 Virginia Tech, supra note 1 at 43.
11 Institute for Environmental Negotiation (“IEN”), Sea Level Rise in Hampton Roads: Findings from the Virginia
Beach Listening Sessions, March 30-31, 2011, Final Report 61, available at
http://www.virginia.edu/ien/docs/Sea_Level_Rise%20final%20report%207-19.pdf.
12 Virginia Tech, supra note 3 at 27.

13 IEN, supra note 11 at 57.
14 Id. at 59, 65.
15 See Bryant, supra note 4 at 36.
16 Virginia Tech, supra note 3 at 35.
17 Id. at 42.
18 Id. at 28.
19 Id. at 13.
20 IEN, supra note 11 at 64.
21 Virginia Tech, supra note 3 at 21.
22 IEN, supra note 11 at 61.
23 Id. at 64.

24 Bryant, supra note 4 at 35; see also IEN, supra note 2 at 64-65.
25 See Virginia Tech, supra note 3 at 22.
26 IEN, supra note 11 at 57, 61.
27 Id. at 43; Georgetown Climate Center, supra note 1 at 11.
28 William A. Stiles, “A ‘Toolkit’ for Sea Level Rise Adaptation in Virginia” 4.1.3, on file with author.
29 Id.
30 Id. at 3.1.
31 Bryant, supra note 4 at 35.
32 IEN, supra note 11 at 60.
33 Bryant, supra note 4 at 35.
34 Id. at 81.
35 Bryant, supra note 4 at 35.

36 Id. at 27.
37 Georgetown Climate Center, supra note 1 at 17.
38 Virginia Tech, supra note 3 at 40.
39 IEN, supra note 11 at 81.
40 Id. at 58-59.
41 Id. at 60.
42 Id. at 63.
43 Stiles, supra note 24 at 4.1.2.
44 Id. at 4.1.4.
45 Virginia Tech, supra note 3 at 7-8.
46 Id. at 9. For specific training and funding opportunities, see id. at 44-45; see also IEN, supra note 11 at 67.
47 IEN, supra note 11 at 64.

48 Id. at 66, 68.
49 See id. at 62-63, 66-67.
50 See Virginia Tech, supra note 3 at 45.
51 IEN, supra note 11 at 63.
52 Id. at 59; Bryant, supra note 4 at 37.
53 IEN, supra note 11 at 57.
54 Virginia Tech, supra note 3 at 34.
55 IEN, supra note 11 at 57.

56 Stiles, supra note 24 at 3.1.; Virginia Tech, supra note 3 at 8.
57 See generally Stiles, supra note 24; Virginia Tech, supra note 3 at 2.
58 IEN, supra note 11 at 57.
59 See Stiles, supra note 24 at 4.1.1.
60 Id. at 3.2.

Another VDOT Drainage Project Engineered to Fail

By G. C. Morrow

After reviewing VDOT’s current Mathews Courthouse drainage project (VDOT #87865), I decided to look at previous projects to see if I could find a pattern in their failures. It is extremely hard to conceive that these projects with their half million plus engineering budgets fail so miserably at their purpose. At first glance, it appears that the engineers are attempting to move their drainage conveyances to more accessible locations, but even the greenest of engineers should know better than to try to drain water uphill.

Case in point is the Wards Corner Project at Routes 14 and 198 (VDOT# 56940). VDOT has two outfalls just north of Wards Corner on Rt. 198 that are so neglected they can only be found by locating the endwalls and large pipes. South of Wards Corner, there are 3 outfalls much lower in elevation than the one at Wards Corner, and they are necessary to handle several hundred acres of stream flow, as well as roadside drainage. All roadside ditches in this vicinity are so poorly maintained that the flow lines are almost completely lost, and many large pipes are obscured in the right-of-way.

Wards Corner, July 21, 2012 Photo: C. J. Bova

Wards Corner, July 21, 2012 Photo: C. J. Bova

The Mathews High School football field and the Mathews County Park on 198 have been flooded several times since the Wards Corner Project completion. On one occasion, I photographed a 200′ wide river on our football field and park. At the same time, the pipes at Wards Corner were less than half full because water still goes downhill, and the high school is downhill from Wards Corner.

High school football field Aprl 15, 2014 Photo: GC Morrow

High school football field Aprl 15, 2014                                                               Photo: GC Morrow

This $1.618 million project was a gross waste of resources and will cause perpetual flooding of downstream locations and personal property from roads that still need proper and adequate conveyance of storm water and stream flow. VDOT could have invested a much smaller amount to restore the outfall to Stutts Creek behind the high school, and clear or even replace the pipes in the VDOT easement along the football field, and convey the water from Route 198 and not let it flood the school and park properties. (See State Highway Plat Book 3, pg. 211, 0014 057 305.)

An earlier project on East River Road, Route 660 (VDOT #61013) $1.334 million, did not address Route 14 drainage between Route 660 at Foster and Route 617 at North. The roadside ditches less than .25 mile west of Foster are flooded most of the time. The 1965 USGS topographic map shows that three uphill streams that should cross Route 14 are channelized to roadside ditches in the VDOT right-of-way. The adjacent properties are now flooded along the roadside ditch. No matter how well a project is engineered and designed, if necessary adjacent conveyances are not maintained, any project can negatively impact the already neglected system.

The Mathews Courthouse Route 14 Drainage Improvement Project (#87865) is another case of a poorly engineered and designed package. The engineers relied on computer-generated maps without ground verification to identify the drainage areas. The 2011 USGS topo included historical drainage ditches which no longer function, and in some cases, no longer exist. That 2011 map also labeled a ditch north of the Hyco Subdivision as Put In Creek. First, it’s barely identifiable today, and second, it’s a created drainage ditch, not Put In Creek, and third, it is downhill from the planned location of the four new pipes crossing 198 to Put In Creek.

VDOT Route 14 Drainage Improvement Plan Map pg. 10

VDOT Route 14 Drainage Improvement Plan Map pg. 10

Most of the drainage areas in the plan are overstated because the natural drainage pattern for them would be to the Morris Creek watershed, not to the Put In Creek/East River watershed. The boundary between the Morris Creek and Put In Creek watersheds is incorrect on both national and state maps. The 198 connection to the Put In Creek ditch could be adequate to carry water from the road, but not any of the Morris Creek watershed.

If the original ditches were functioning properly, the water from the Hyco Subdivision and adjacent land would go to Morris Creek by two routes.

Ditch 1. runs parallel to Route 198 north to Critter Lane where it can enter Morris Creek, but the ditch is constrained by a collapsed 15″ pipe.

Ditch 2 is to the east of Hyco Subdivision where VDOT has an 800’ outfall. (198-4957-02, sheet 5) The deeded 800’ outfall follows the proper contour northward to Morris Creek. This conveyance has a dimension of approximately 12′ wide and 7′ deep at the tree line, then it tapers down to 2′ wide 2′ deep approximately 300′ from the roadside. The landowners adjacent to this failed ditch have documented many complaints about standing water on their property to VDOT without response.

The plan also shows water being directed to Put In Creek from the Liberty Square Courthouse to Church Street through a ditch system which failed a long time ago. The plan does not address restoring it.

More than 100 acres of water from part of Glebe Road, the rest of the Liberty Square Courthouse, the Cricket Hill Apartments, and Bank of America crosses under Route 198 to the east to an outfall at 10601 Buckley Hall Road. This is part of the same Ditch 1 listed under Hyco Subdivision which goes to Critter Lane and Morris Creek.

Both Ditch 1 and Ditch 2 have partly failed and have created several acres of flooded upland, now being called nontidal wetlands.

Like the situation with Hyco Subdivision, the water from the land behind Food Lion should drain to Morris Creek, not Put In Creek. Because the original ditches that conveyed the water to Morris Creek no longer function, water leaves the Food Lion parking lot via a 48” pipe near the Chinese restaurant then funnels east into the woods behind the Food Lion. When rain exceeds 1″ an hour for 3 or 4 hours, the woods store water until the ground is saturated. The water then converts to a 70-acre sheet flow, where every drop falling on this land has to go uphill to Food Lion, and then to Faulkner and Son. This conveys torrents of water to Main Street and continues to run for days.

When I approached the lead engineer at the public design hearing, he was rather arrogant and abrasive, and stressed his job was to drain the 70 acres. The map he provided showing the lands to be drained showed no houses, no businesses, no roads, and that the drainage area was definitely downhill from Food Lion.

The median storm water level already overtops the Put In Creek ditch and adjacent property located behind Faulkner and Son. I could say much more, and I have spoken to Jim Brent, P.E., Sean Trapani, former Saluda R.A., Delegate Keith Hodges, Planning and Zoning Director John Shaw, and several engineers at the public design hearing. But there has been no change in the project except to increase the cost.

The unanswered questions are:

  1. Why hasn’t VDOT explored the possibility that the two existing pipes across Buckley Hall Road, including the one destroyed by utility pole placement years ago, might be adequate in conjunction with system maintenance and restoration?
  1. The new Westville Community project shows water discharge at 7.75 ft. elevation into the VDOT pipe system which shows a 5.42 ft. elevation at its discharge point (per VDOT plans). Will this 13 acres of additional storm water flow uphill to Hyco Corner? Or will it further damage the properties downhill to the east of the Westville Community project?
  1. Why hasn’t VDOT realized any additional water collected at Buckley Hall Road will exceed the capacity of the feeble ditch between Hyco Corner and Church Street (Route 611) at the Firehouse?
  1. Two 4’ x 7’ box culverts are 2.91 times larger than the two 42” pipes now at Church Street. They are intended to let more water out, but will definitely let more water in as well.

    Put In Creek at Church Street 42" pipe two hours before predicted low tide of .28 ft       Photo: CJ Bova

    Put In Creek at Church Street 42″ pipe two hours before predicted low tide of .28 ft      

  1. Did anyone with tidal engineering or analysis experience review the plans that use a high tide water surface elevation of 0.31 feet when high tides range from 1.8 to over 3 feet?

    Put In Creek after 2.9 ft high tide Photo: CJ Bova

    Put In Creek after 2.9 ft high tide Photo: CJ Bova

I hope that someone at VDOT will ground verify and redesign this poorly conceived project that will definitely increase the probability and severity of flooding–both tidal and non-tidal.

Notice how the original outfalls traveled great distances to avoid any close tidal contact. This is another no-brainer that can’t be taught. We expect more from over $945,000 than bad, poorly directed engineering.


G.C. Morrow’s family‘s roots in Mathews go back to 1725. He’s worked in, traveled through, or explored most all of the county. He is co-founder of the Ditches of Mathews County Project which has worked to raise awareness of the problems and offer solutions to VDOT’s drainage issues that are affecting Mathews County.

He’s worked and fought with many state and federal agencies for the environmental well-being of Mathews and was one of the citizens on the county’s Ditch Enhancement project Committee who tried to provide local knowledge to the engineers. As Business Group Chair on the Piankatank TMDL Steering Committee to improve water quality, he fought for truth in reports and provided more accurate information than the state’s computer-generated numbers for wildlife, livestock and pet populations. In January 2016, G.C. began his first term on the Mathews County Board of Supervisors. This open letter is a personal statement of his views based on his experience and knowledge of Mathews County.